Surrey compared to other areas
Casualties in Surrey have a followed a trend approximating to Great Britain as a whole
These comparisons use information from Department for Transport records. The most recent data in those records is from 2023.
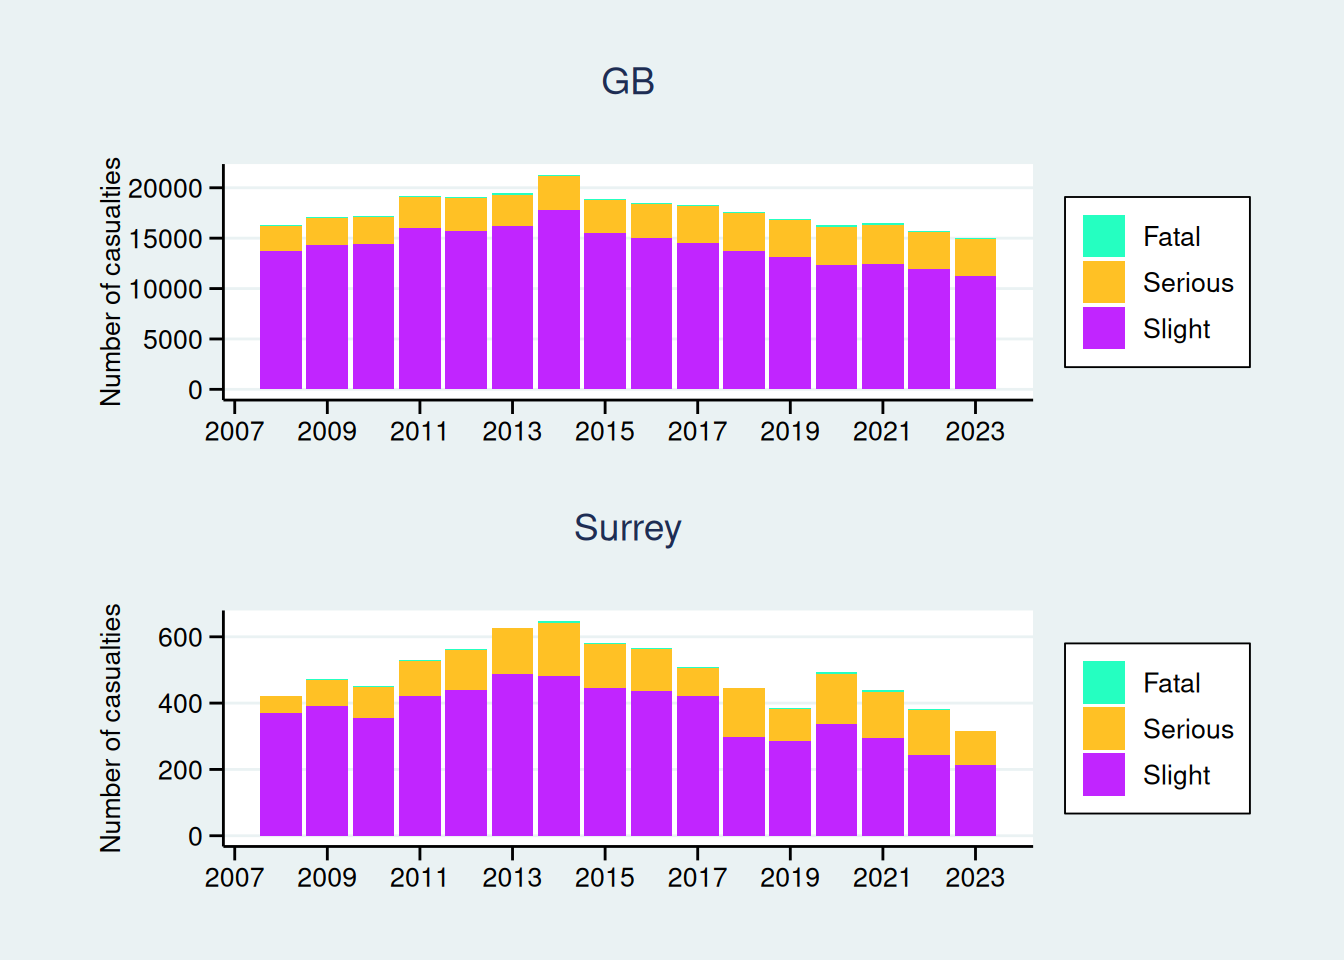
The number of cycling casualties is shown below for Surrey for 2008 onwards along with Great Britain. The scale showing the number of casualties is different between the two charts. Surrey has a similar trend to Great Britain as a whole, casualties rising to 2014 and then declining, except the rate of increase and decrease have been greater in Surrey.
Surrey has a greater proportion of cyclists killed or injured than Great Britain
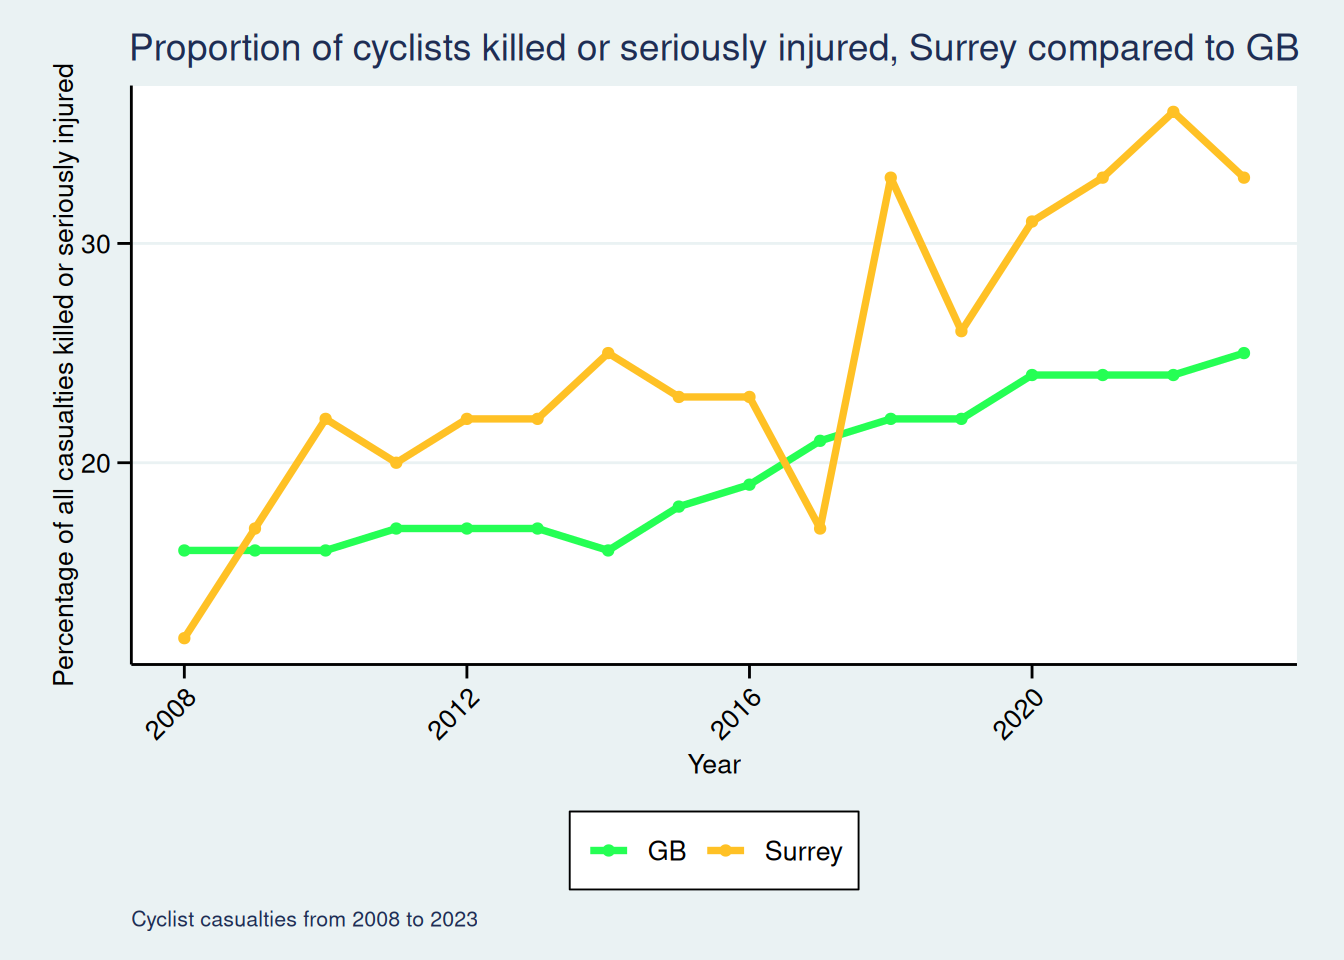
As described on the Surrey trends page, one of the main trends in cyclist casualties in Surrey has been the rise in the proportion of people killed or seriously injured (KSI). The chart below shows there is also an upward trend for GB as whole; Surrey is also shown. The percentage of casualties that are KSI has fluctuated more in Surrey but, in general, is around 4-8 percentage points above GB.
Surrey compared to other authorities
The areas used in this comparison are unitary authorities, English counties and individual London boroughs.
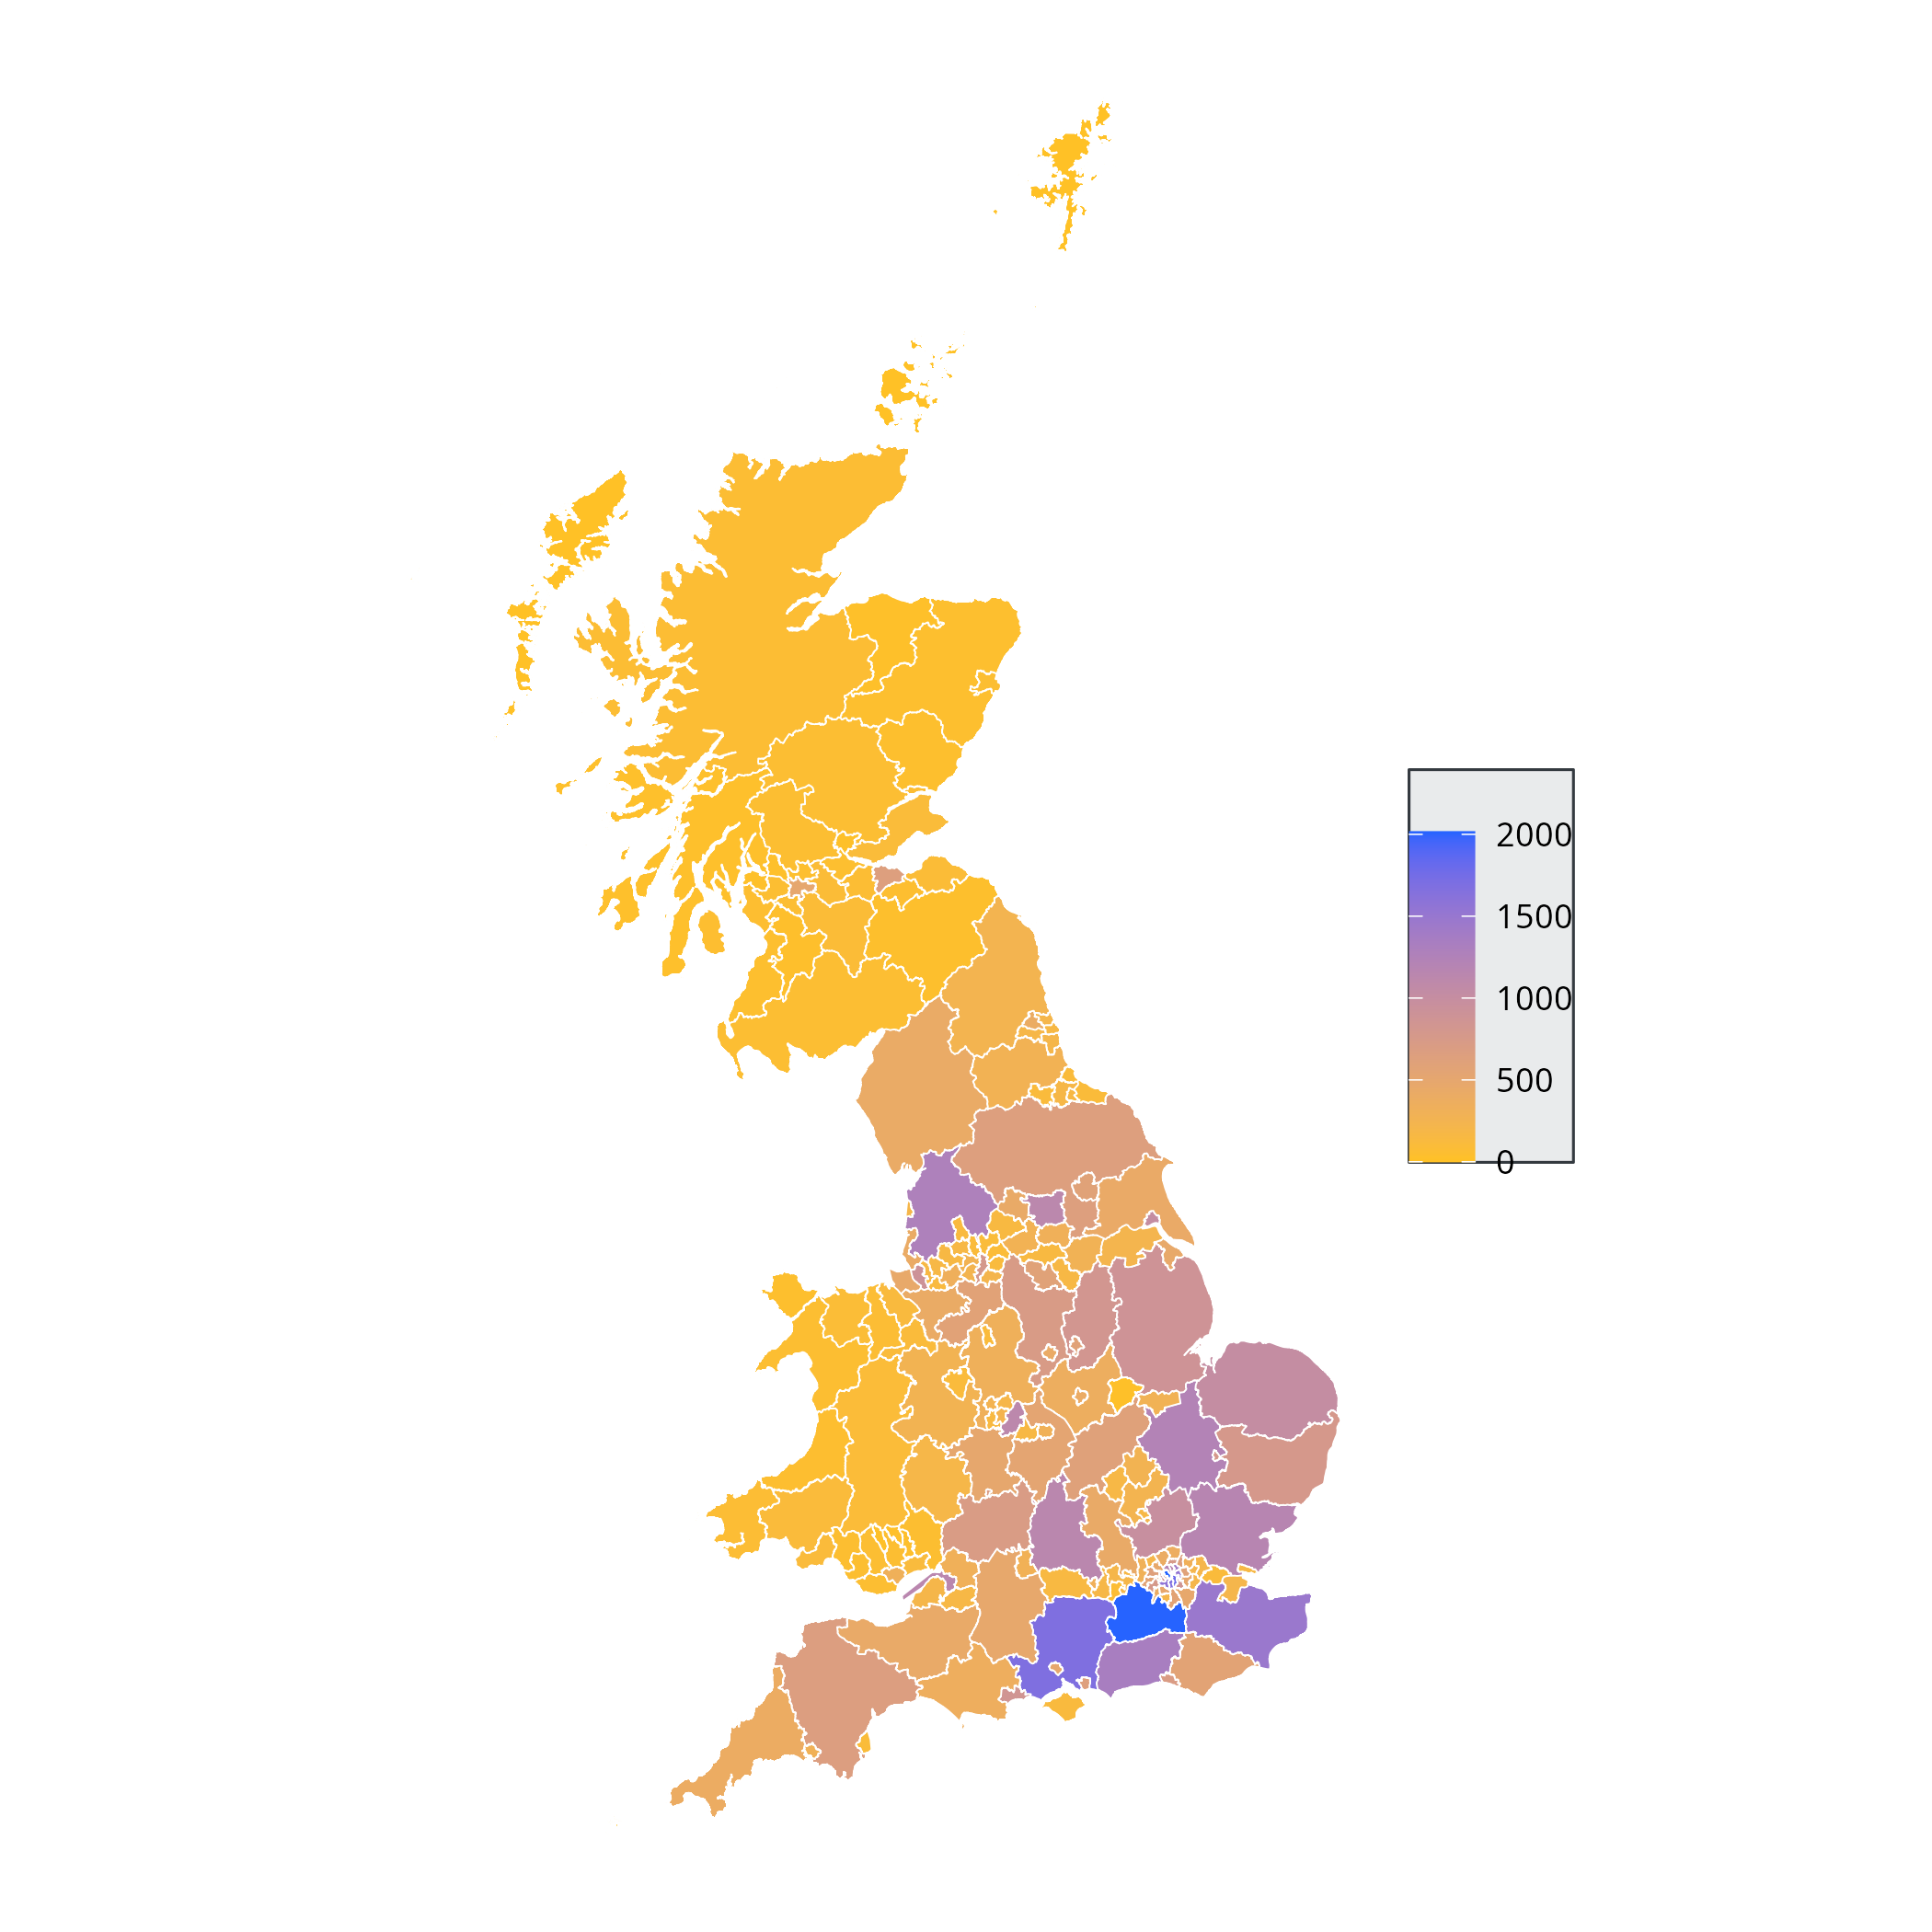
Over the last 5 years aggregated, Surrey has had more cyclist casualties than any other authority
** Zoomable and pannable version of map here. On a separate page as it takes a while to load. **
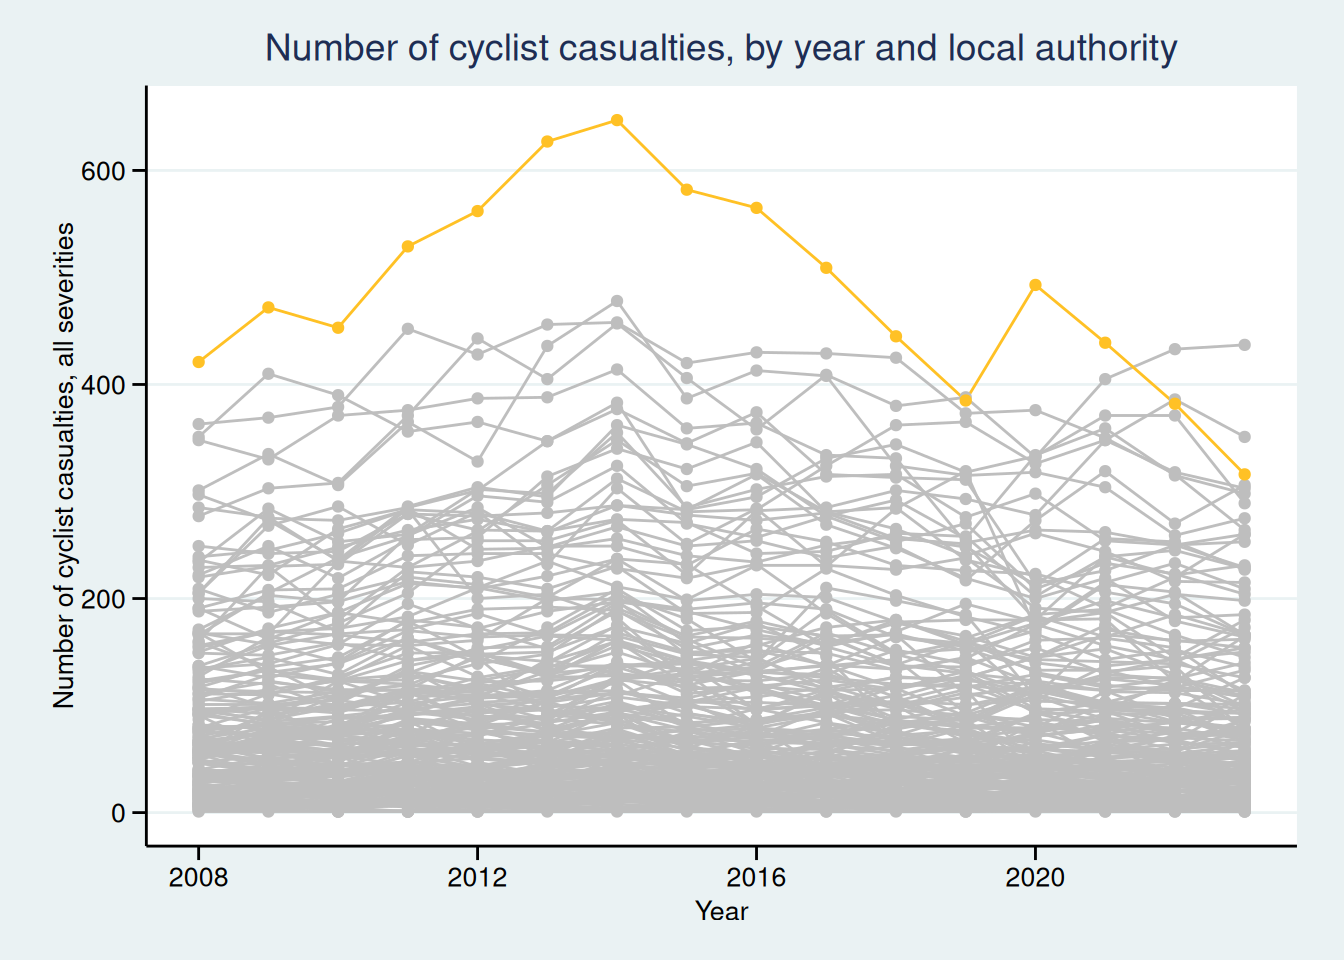
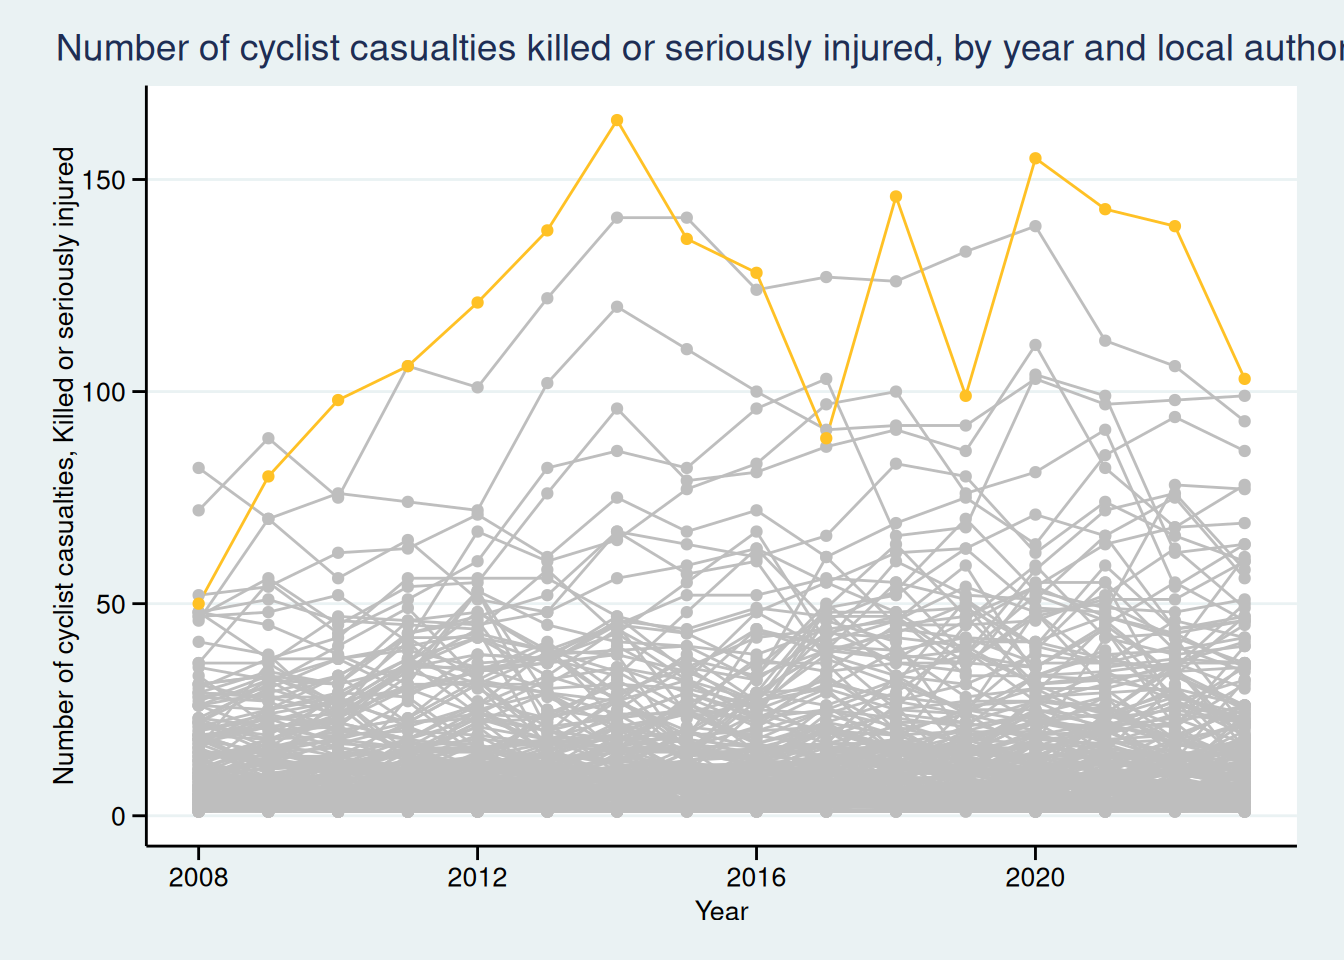
Surrey had more casualties than any other local authority for 13 of the 14 years up to 2021
The graph below shows the yearly cyclist casualties for each local authority, with Surrey highlighted. In the two recent years, Surrey has been the third worst.
Surrey also has the worst record for cyclists being killed or seriously injured, without the improvement of the two most recent years.
Three tables on the data table page show a list of authorities and number of cyclist casualties - one all severities, one killed and seriously injured casualties, and one with the worst authroities by year listed.
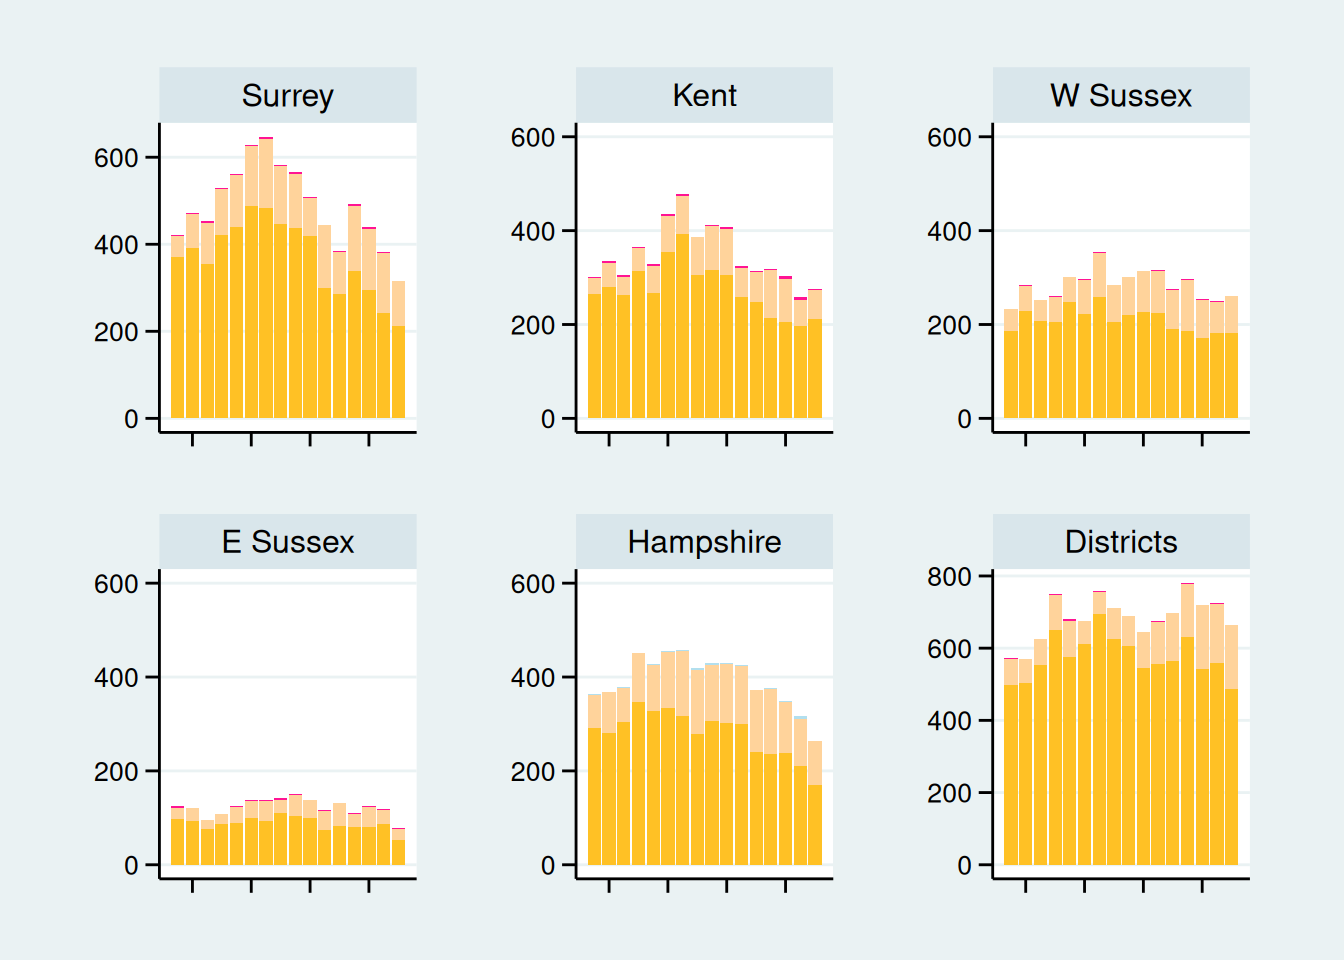
Surrey and our neighbours all differ a little in their casualty trends
For neighbouring authorities, Kent perhaps shows the most similar trend to GB and Surrey. The figures cover cyclist casualties from 2008 to 2023.
Great Britain and Surrey have a similar split of gender
Between 2005 and 2023, 19.3% of cyclist casualties were female.
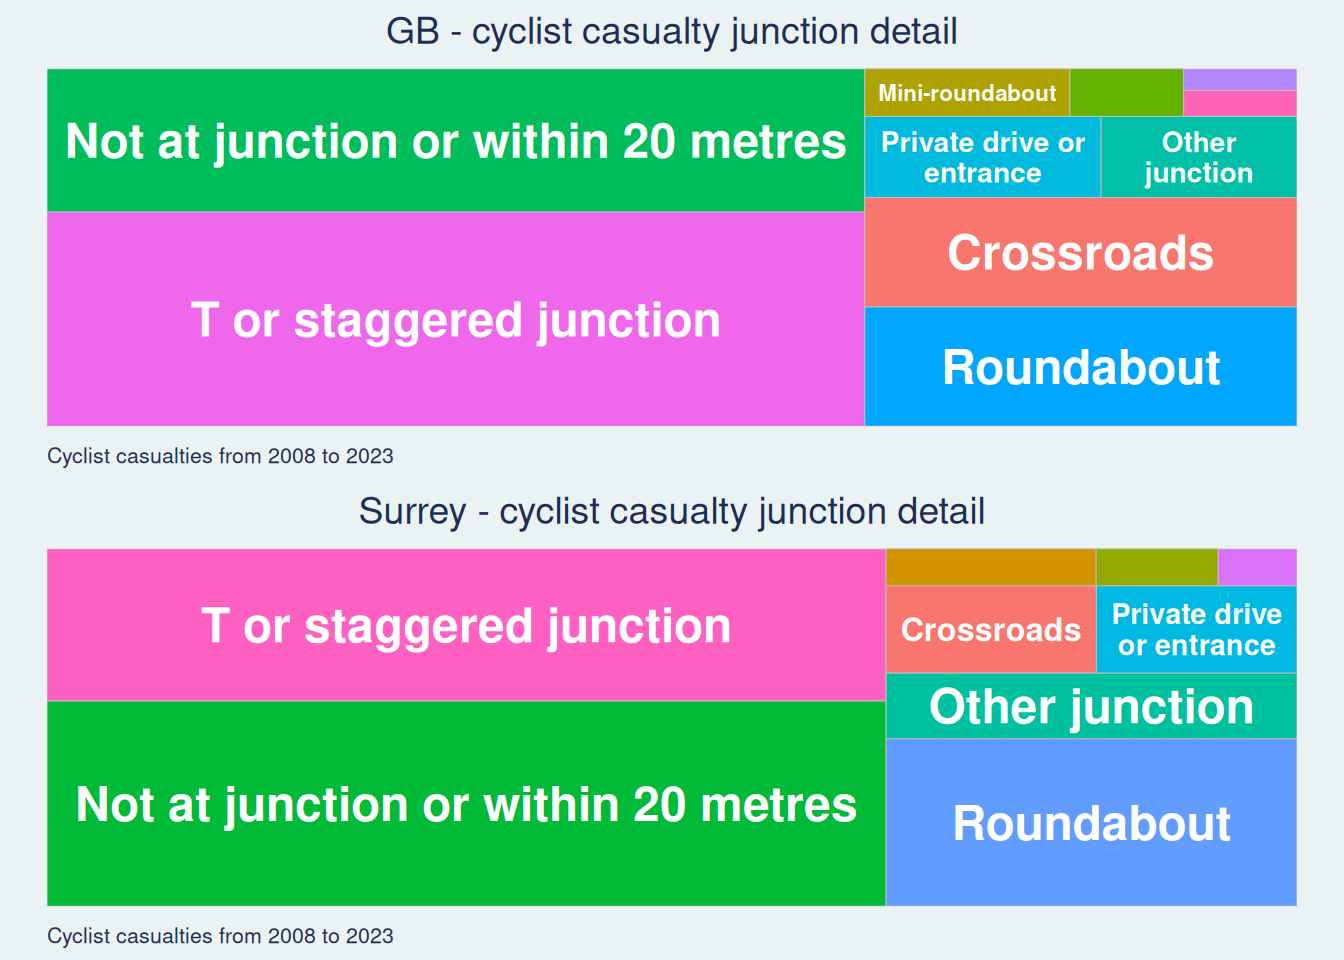
Great Britain has proportionately fewer casualties away from junctions compared to Surrey
The chart below shows that for Great Britain ‘T or staggered junction’ is the single biggest category, with collisions at all junctions combined comprising 69.6% of all cyclist casualties.
Great Britain has had a lower proportion of ‘cyclist-only’ crash types compared to Surrey
As set out on the How page, cyclist casualties can be split into four different types of crash. The proportion of each type in Surrey differs to the GB picture, which has a smaller proportion of “cyclist only” casualties:
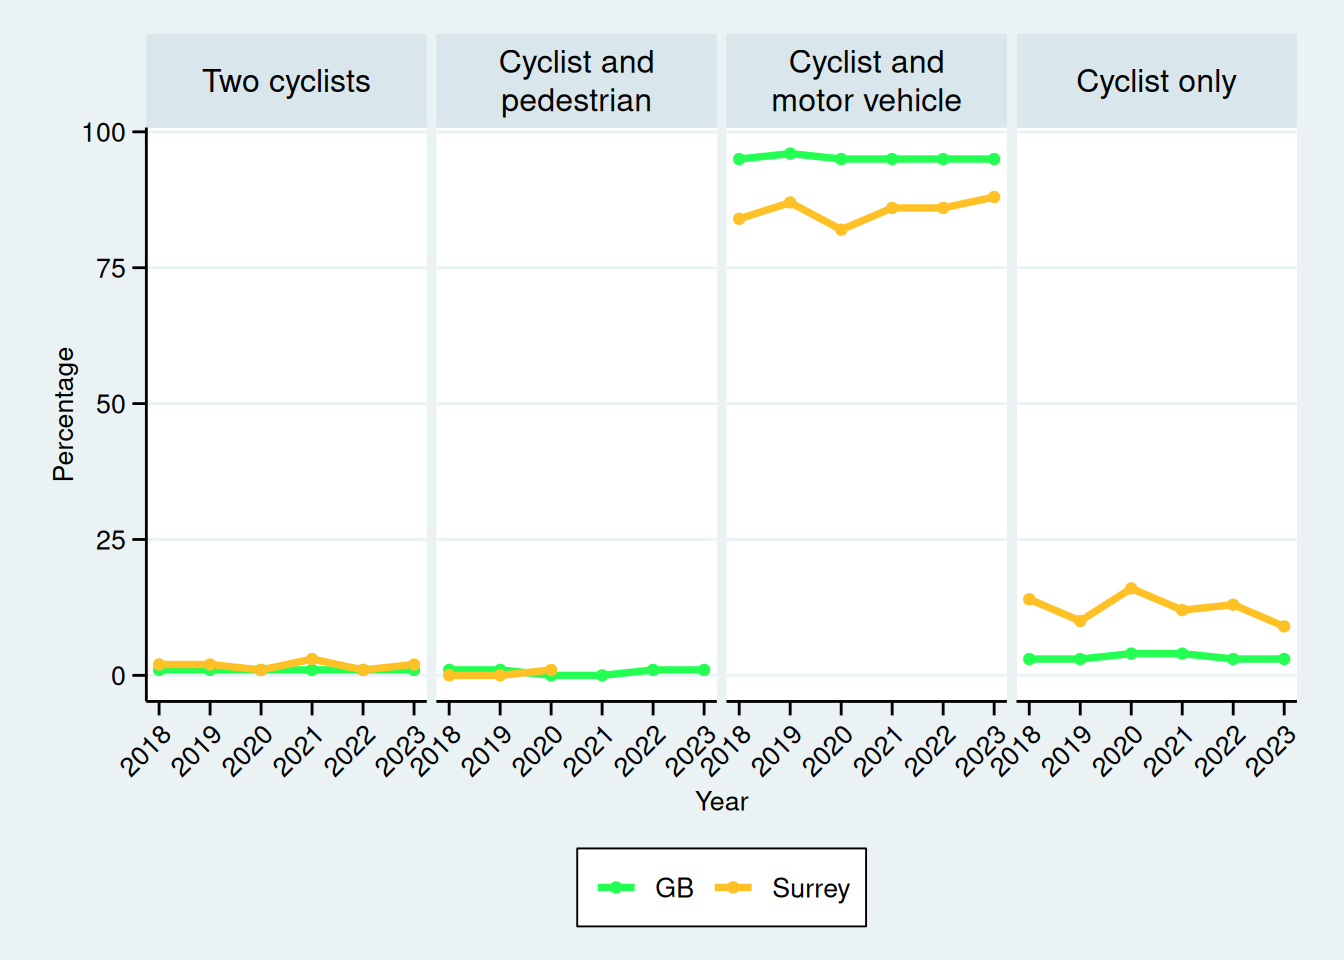
The data table page lists the proportion of cyclist casualties that are ‘cyclist-only’ by area and year. As can be seen, Surrey does indeed have the highest proportion but there is a gradation from high to low; lower proportions are much more numerous. The proportion of cyclist-only casualties in Surrey reduced then rose again in 2020.
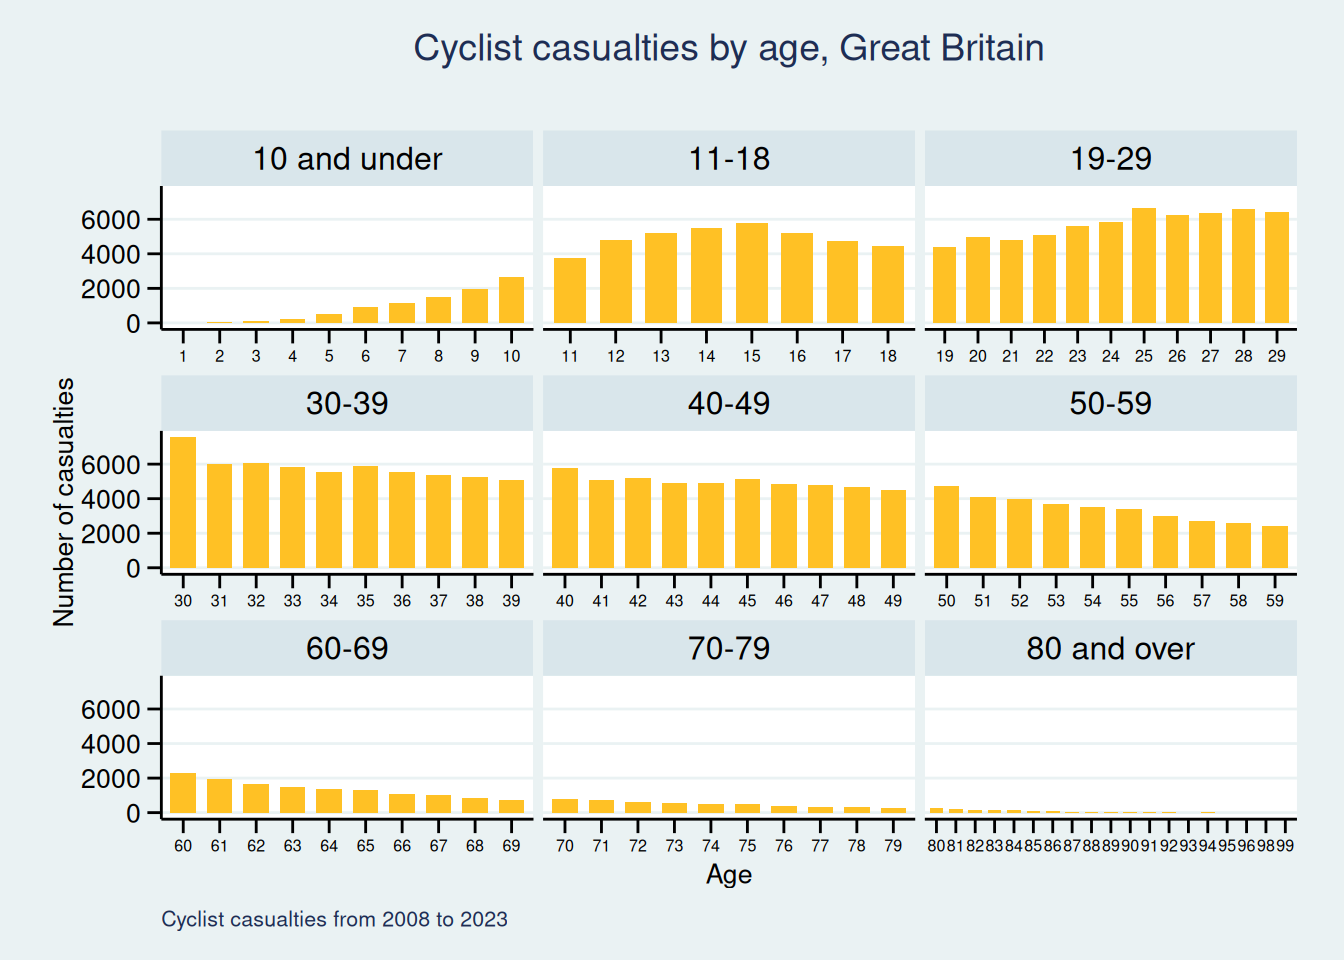
Great Britain and Surrey have a similar casualty age distribution
The chart below shows cyclist casualties by age. The pattern is broadly the same as that of Surrey.
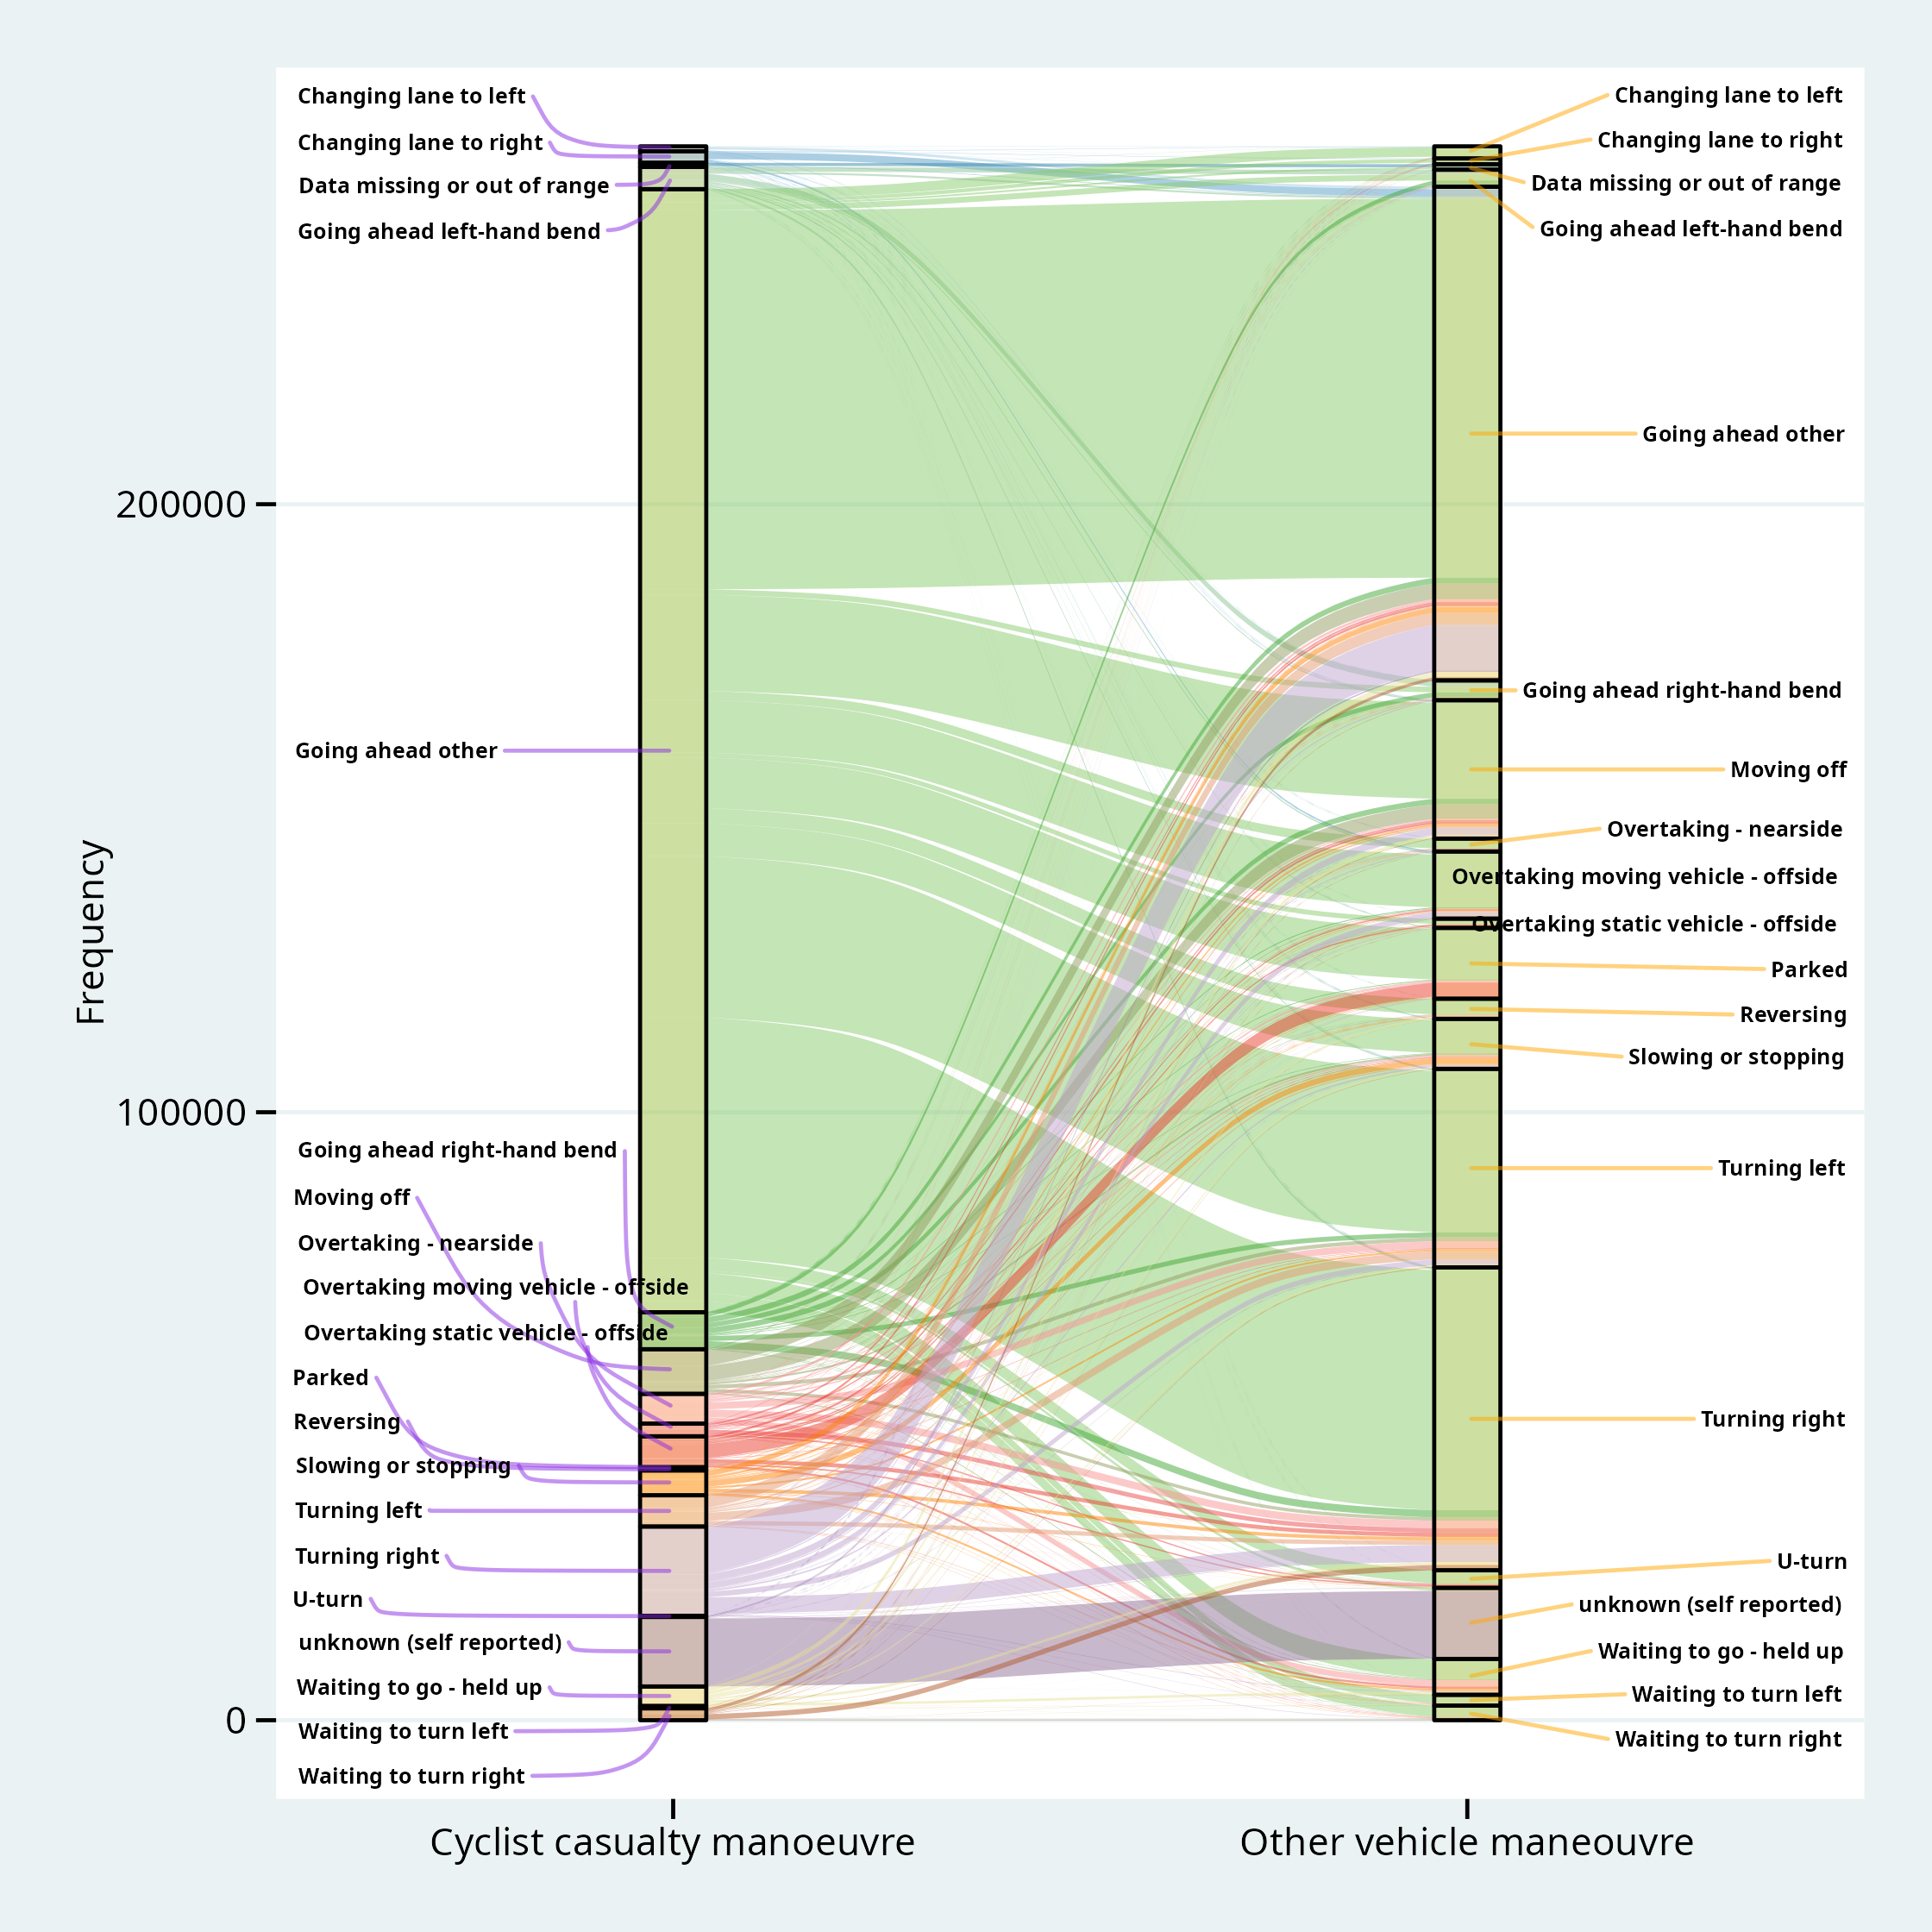
For both GB and Surrey, the cyclist casualty is usually riding straight ahead
The chart for Surrey that corresponds to the GB below is here: they cannot sit side-by-side clearly on the same page.
Collisions involving one cyclist and one motor vehicle have been selected for the following chart. This makes it easier to compare the manoeuvres of the two participants. It represents 258,869 cyclist casualties.
The cyclist casualty was ‘going ahead other’ - as opposed to going ahead on a left-hand or right-hand bend - in 71% of cases. The most common manoeuvres of the other vehicle were going straight ahead, turning left, turning right and moving off.
So the GB and Surrey pictures resemble each other very closely.
 {width=“95%”}
Please refer to the paragraph in the Surrey casualty section for a discussion of the issues involved in looking more closely at this type of collision.