Longer-term trends
The data tables lists the numbers of casualties by year and severity in a table.
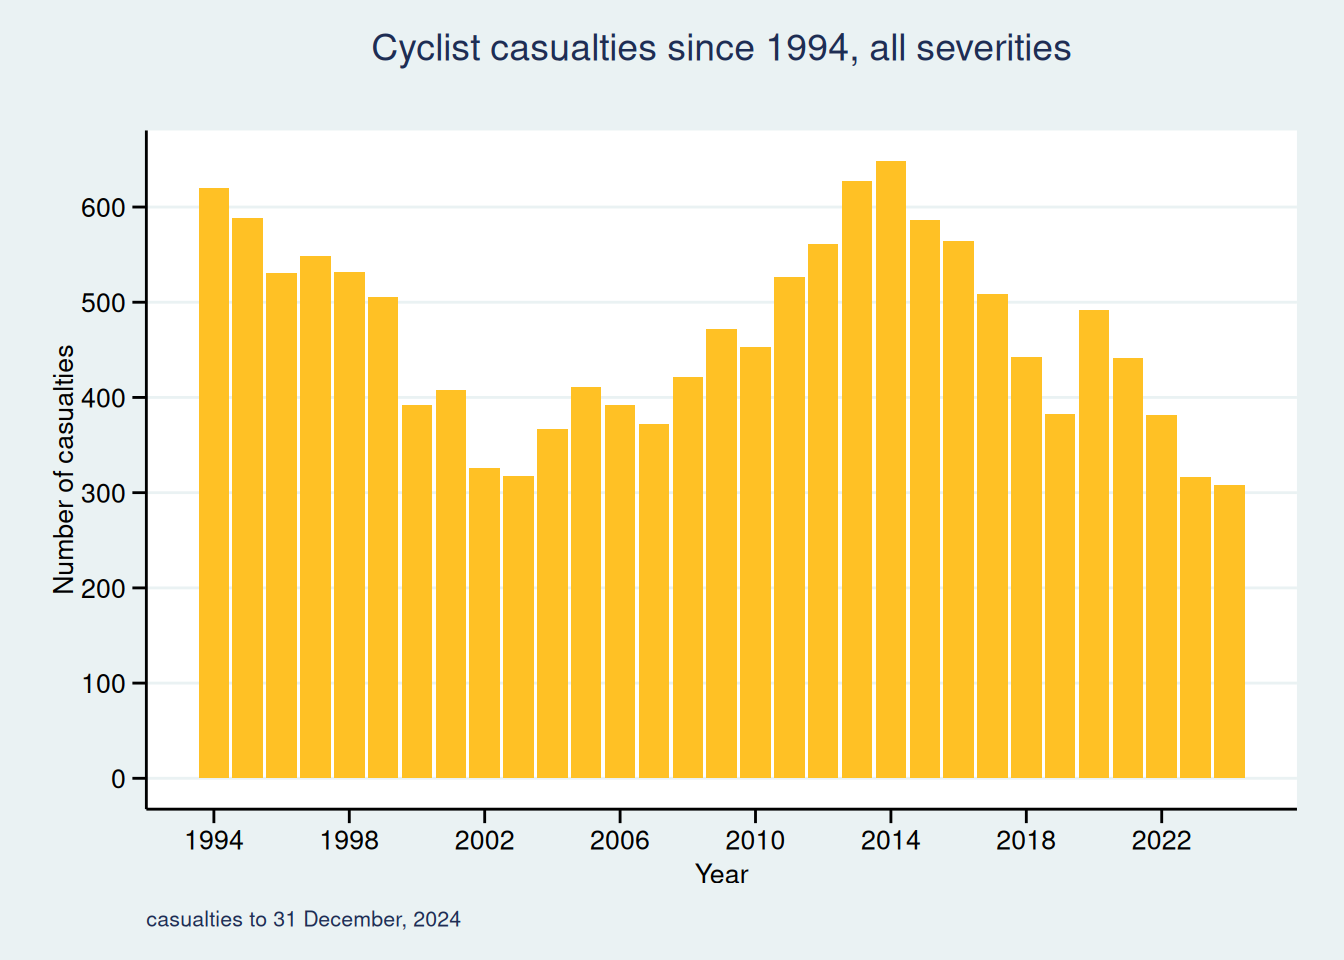
The pattern of casualties since 1994 falls, rises then falls again
The chart below shows the annual number of cyclist casualties since 1994; the year with the highest number was 2014 when there were 648 casualties. In 2025, there were 342 casualties, a rise from 2024 which saw the lowest number over the whole period in the chart.
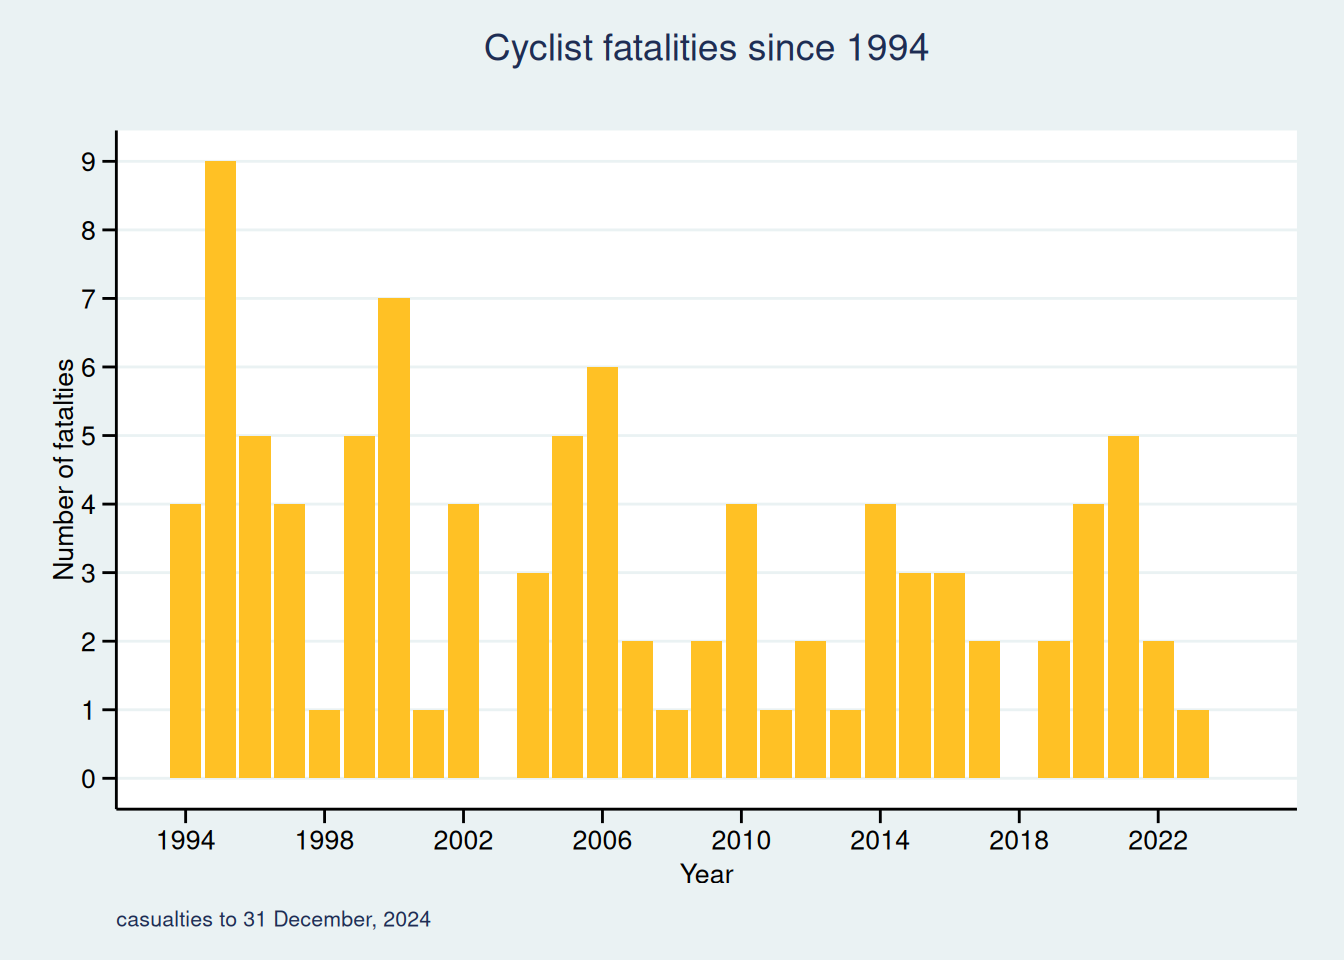
The trend in number of people killed each year whilst cycling has remained flat
The trend in number of people killed each year has remained flat since 1994, varying between 0 and 9:
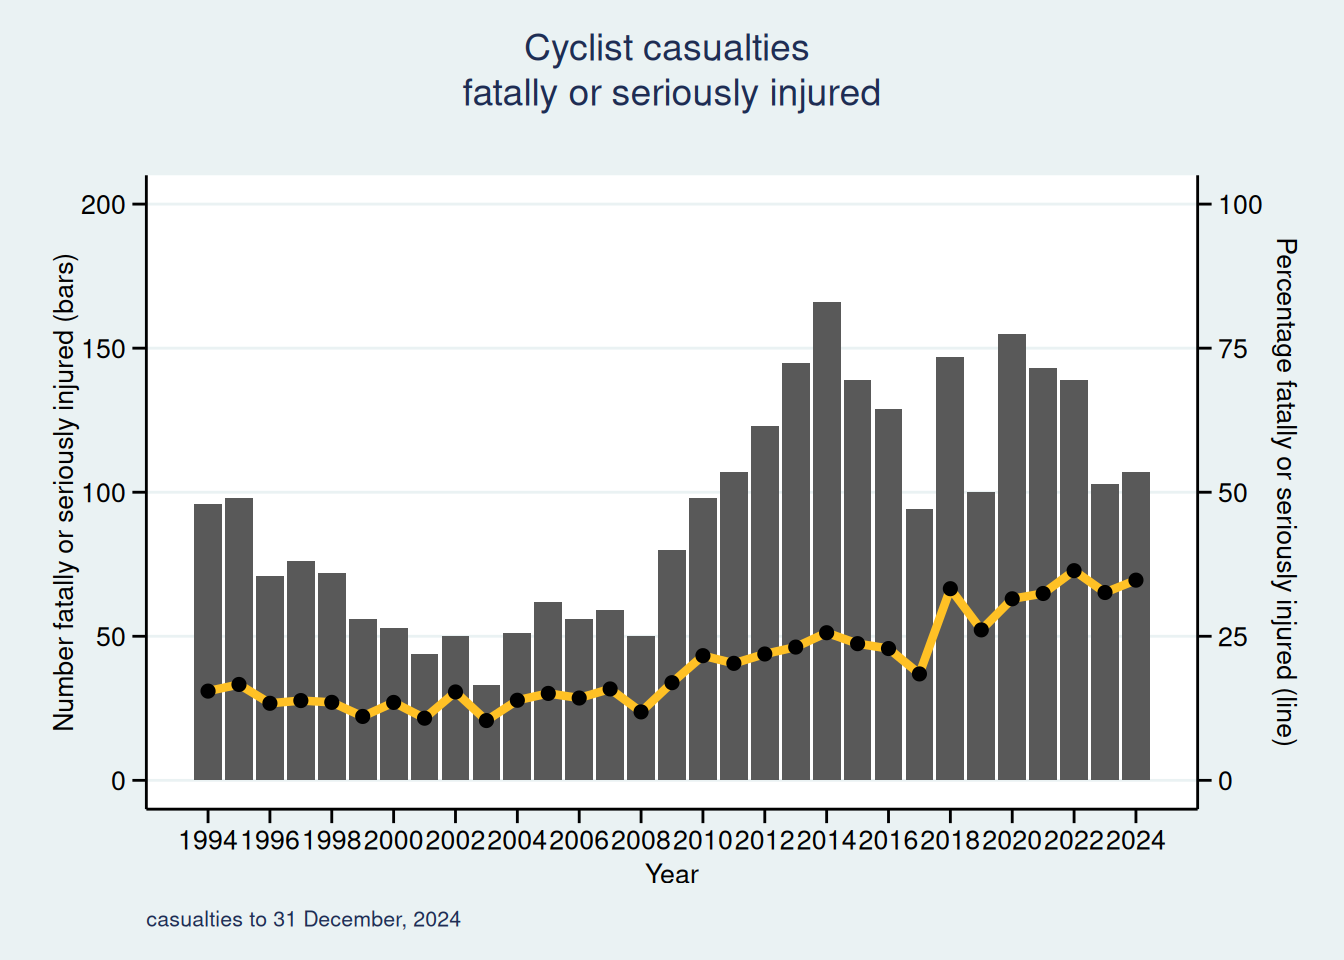
The proportion of casualties fatally or seriously injured rose until recent years
The proportion of cyclist casualties who were fatally or seriously injured, rather than having slight injuries, had an upwards trend to 2020 but has since flattened, as shown in the following chart. In 2018, there was a jump in cyclist serious injuries (and an even greater spike for car occupant serious injuries). The cause was found to be a change in reporting method.
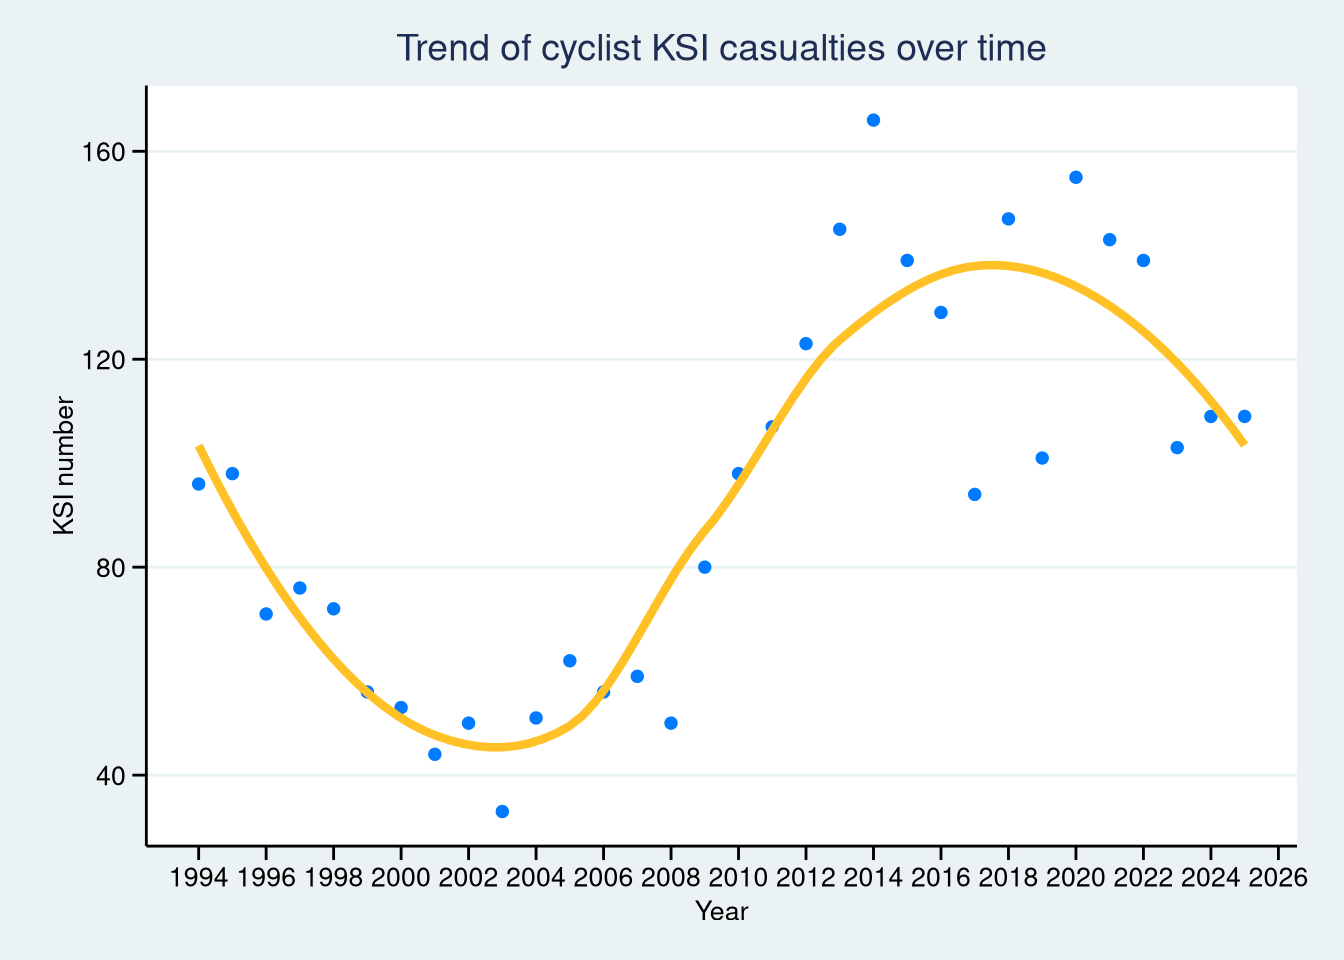
The pattern of casualties killed or seriously injured (KSIs) since 1994 also falls, rises then falls again - there is not a straight-line trend
Cyclist KSIs fell from 1994 to a low in 2003, then rose sharply to a peak of in 2014, before declining again — with a spike in 2020. Fitting a single trend line over the full 32 years would be misleading, since it would describe neither the decline in the first decade nor the rise in the second.So the trend is shown by a LOESS curve, which uses nearby data points to draw a flexible curve that can adapt to the shape of the data.
There is no straight line trend to help predict future cyclist casualties. Two methods can be applied to obtain an idea of what sort of change might be significant, rather than being just a typical variation or ’noise'.
Year-on-year differences
Each year’s KSI is subtracted from the previous year’s KSI:
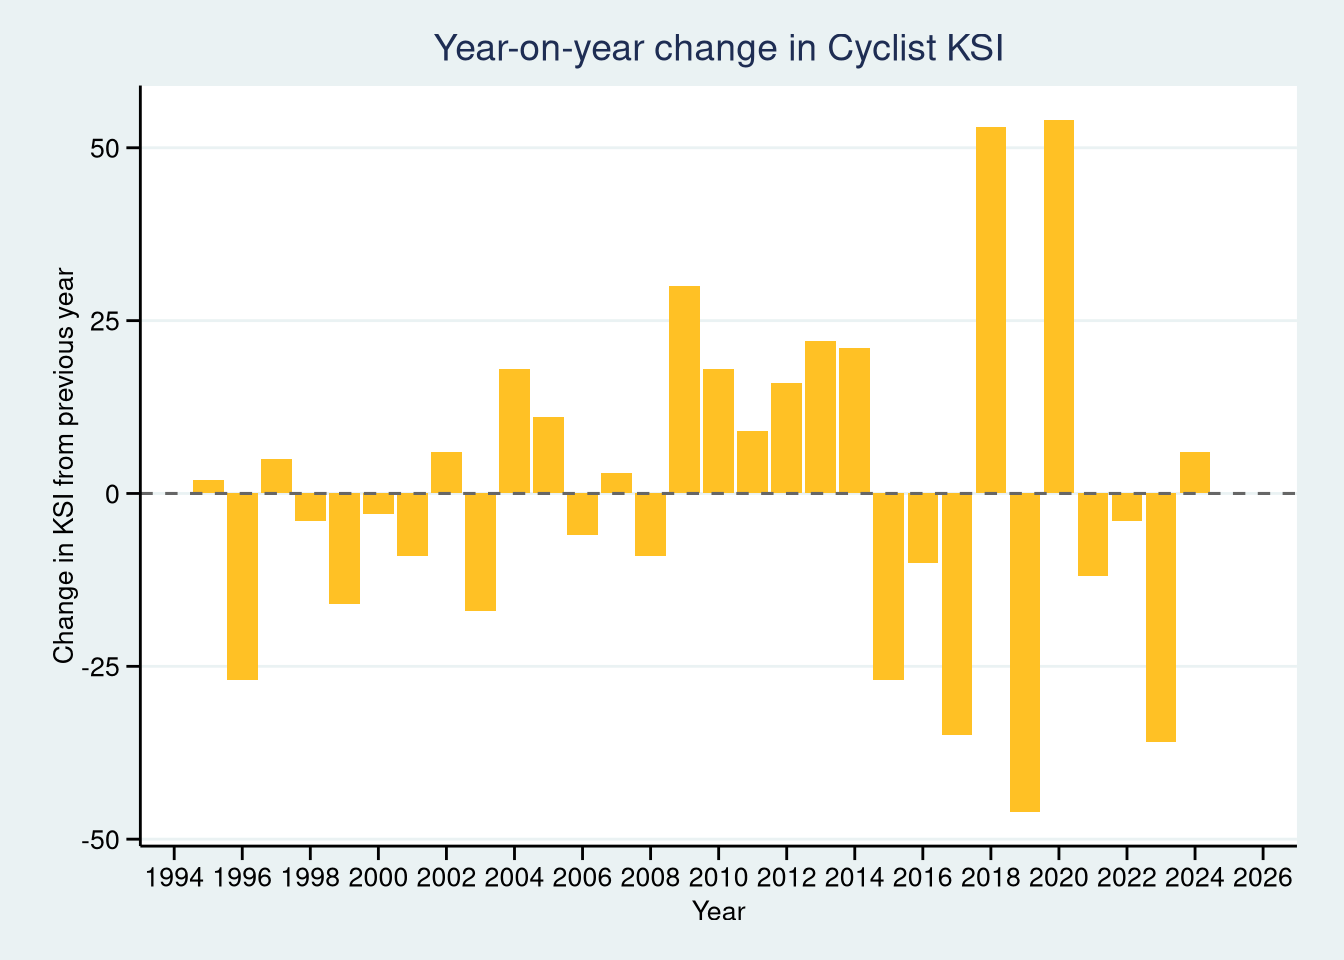
The 2019–2021 period stands out. This is most likely Covid disruption. Apart from that, swings of +/- 20–30 appear relatively common, which is a useful benchmark for judging whether any single year’s change is noteworthy.
‘Residuals’ from the LOESS curve
This method subtracts the value on the trend curve from corresponding actual value to obtain a ‘residual’. Allowing for the underlying trend means a year that looks like a big change in absolute terms might appear less so, depending on where the trend was at that time.
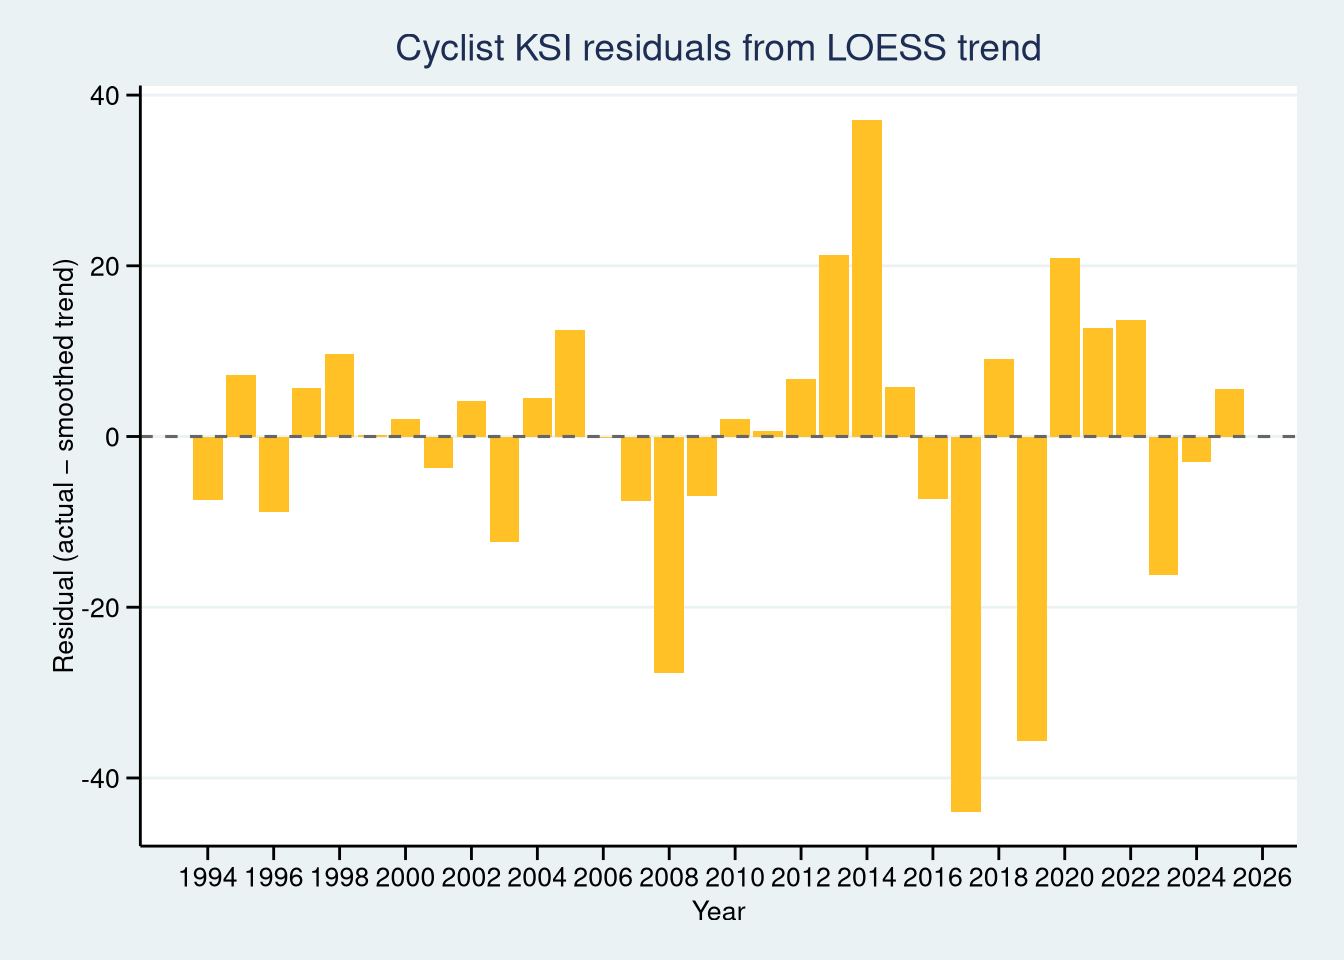
The typical residual is roughly +/- 10–15 casualties, so year-to-year changes smaller than that are hard to distinguish from noise.