Comparisons to other modes
The following sections make a comparison between some of the characteristics of cyclist casualties and those of other modes of transport. From 01 January, 2008 to 31 December, 2025 there have been 60,227 collisions, involving 114,660 vehicles and resulting in 60,227 casualties, of which 8,478 were cyclist casualties.
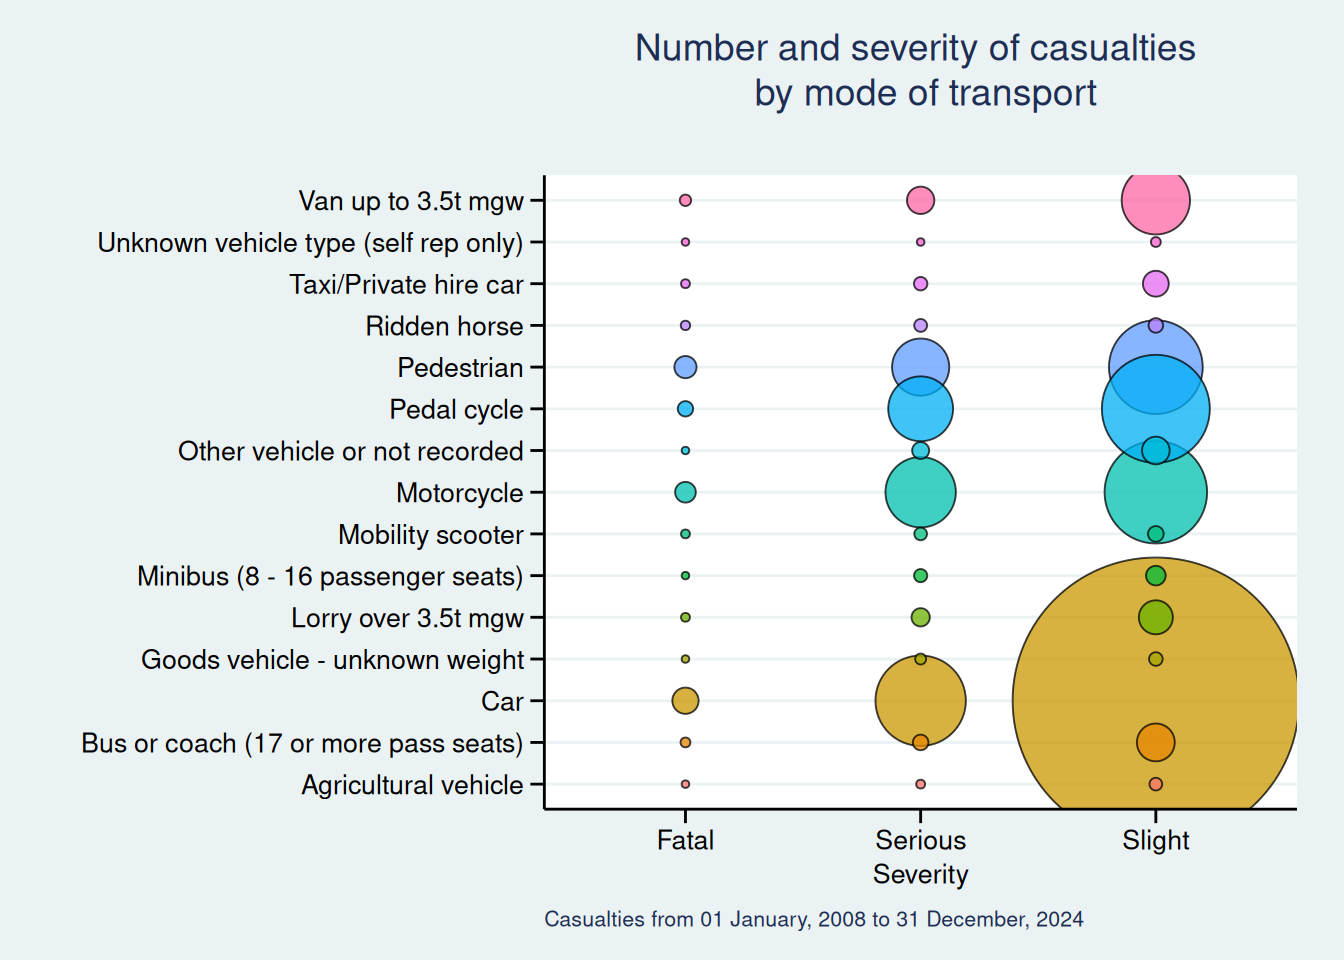
The majority of casualties are car occupants
The chart below shows the proportion of casualties by type of transport. The figures are on the data tables page. Car occupants who were slightly injured comprise 70% of all casualties for all modes of transport.
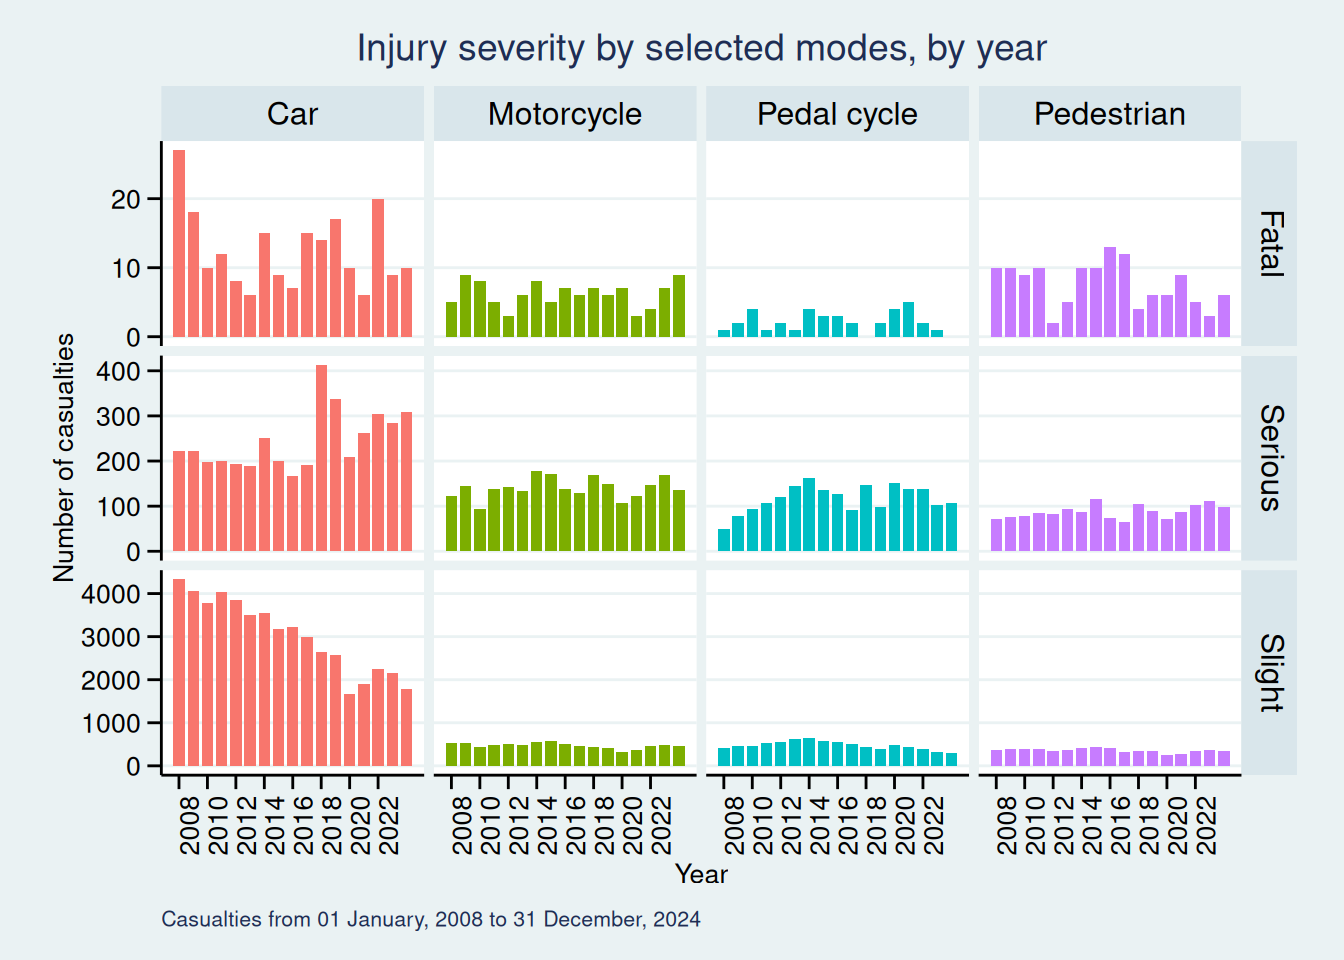
Trends in severity differ between modes of transport
The graph below shows the information broken down into years and only includes car occupants, cyclists, pedestrians and motorcyclists.
The scale on the y-axis is relative to the numbers for that particular severity. Because of this, small changes to the year-on-year numbers on the fatalities graph present as large variations.