Where
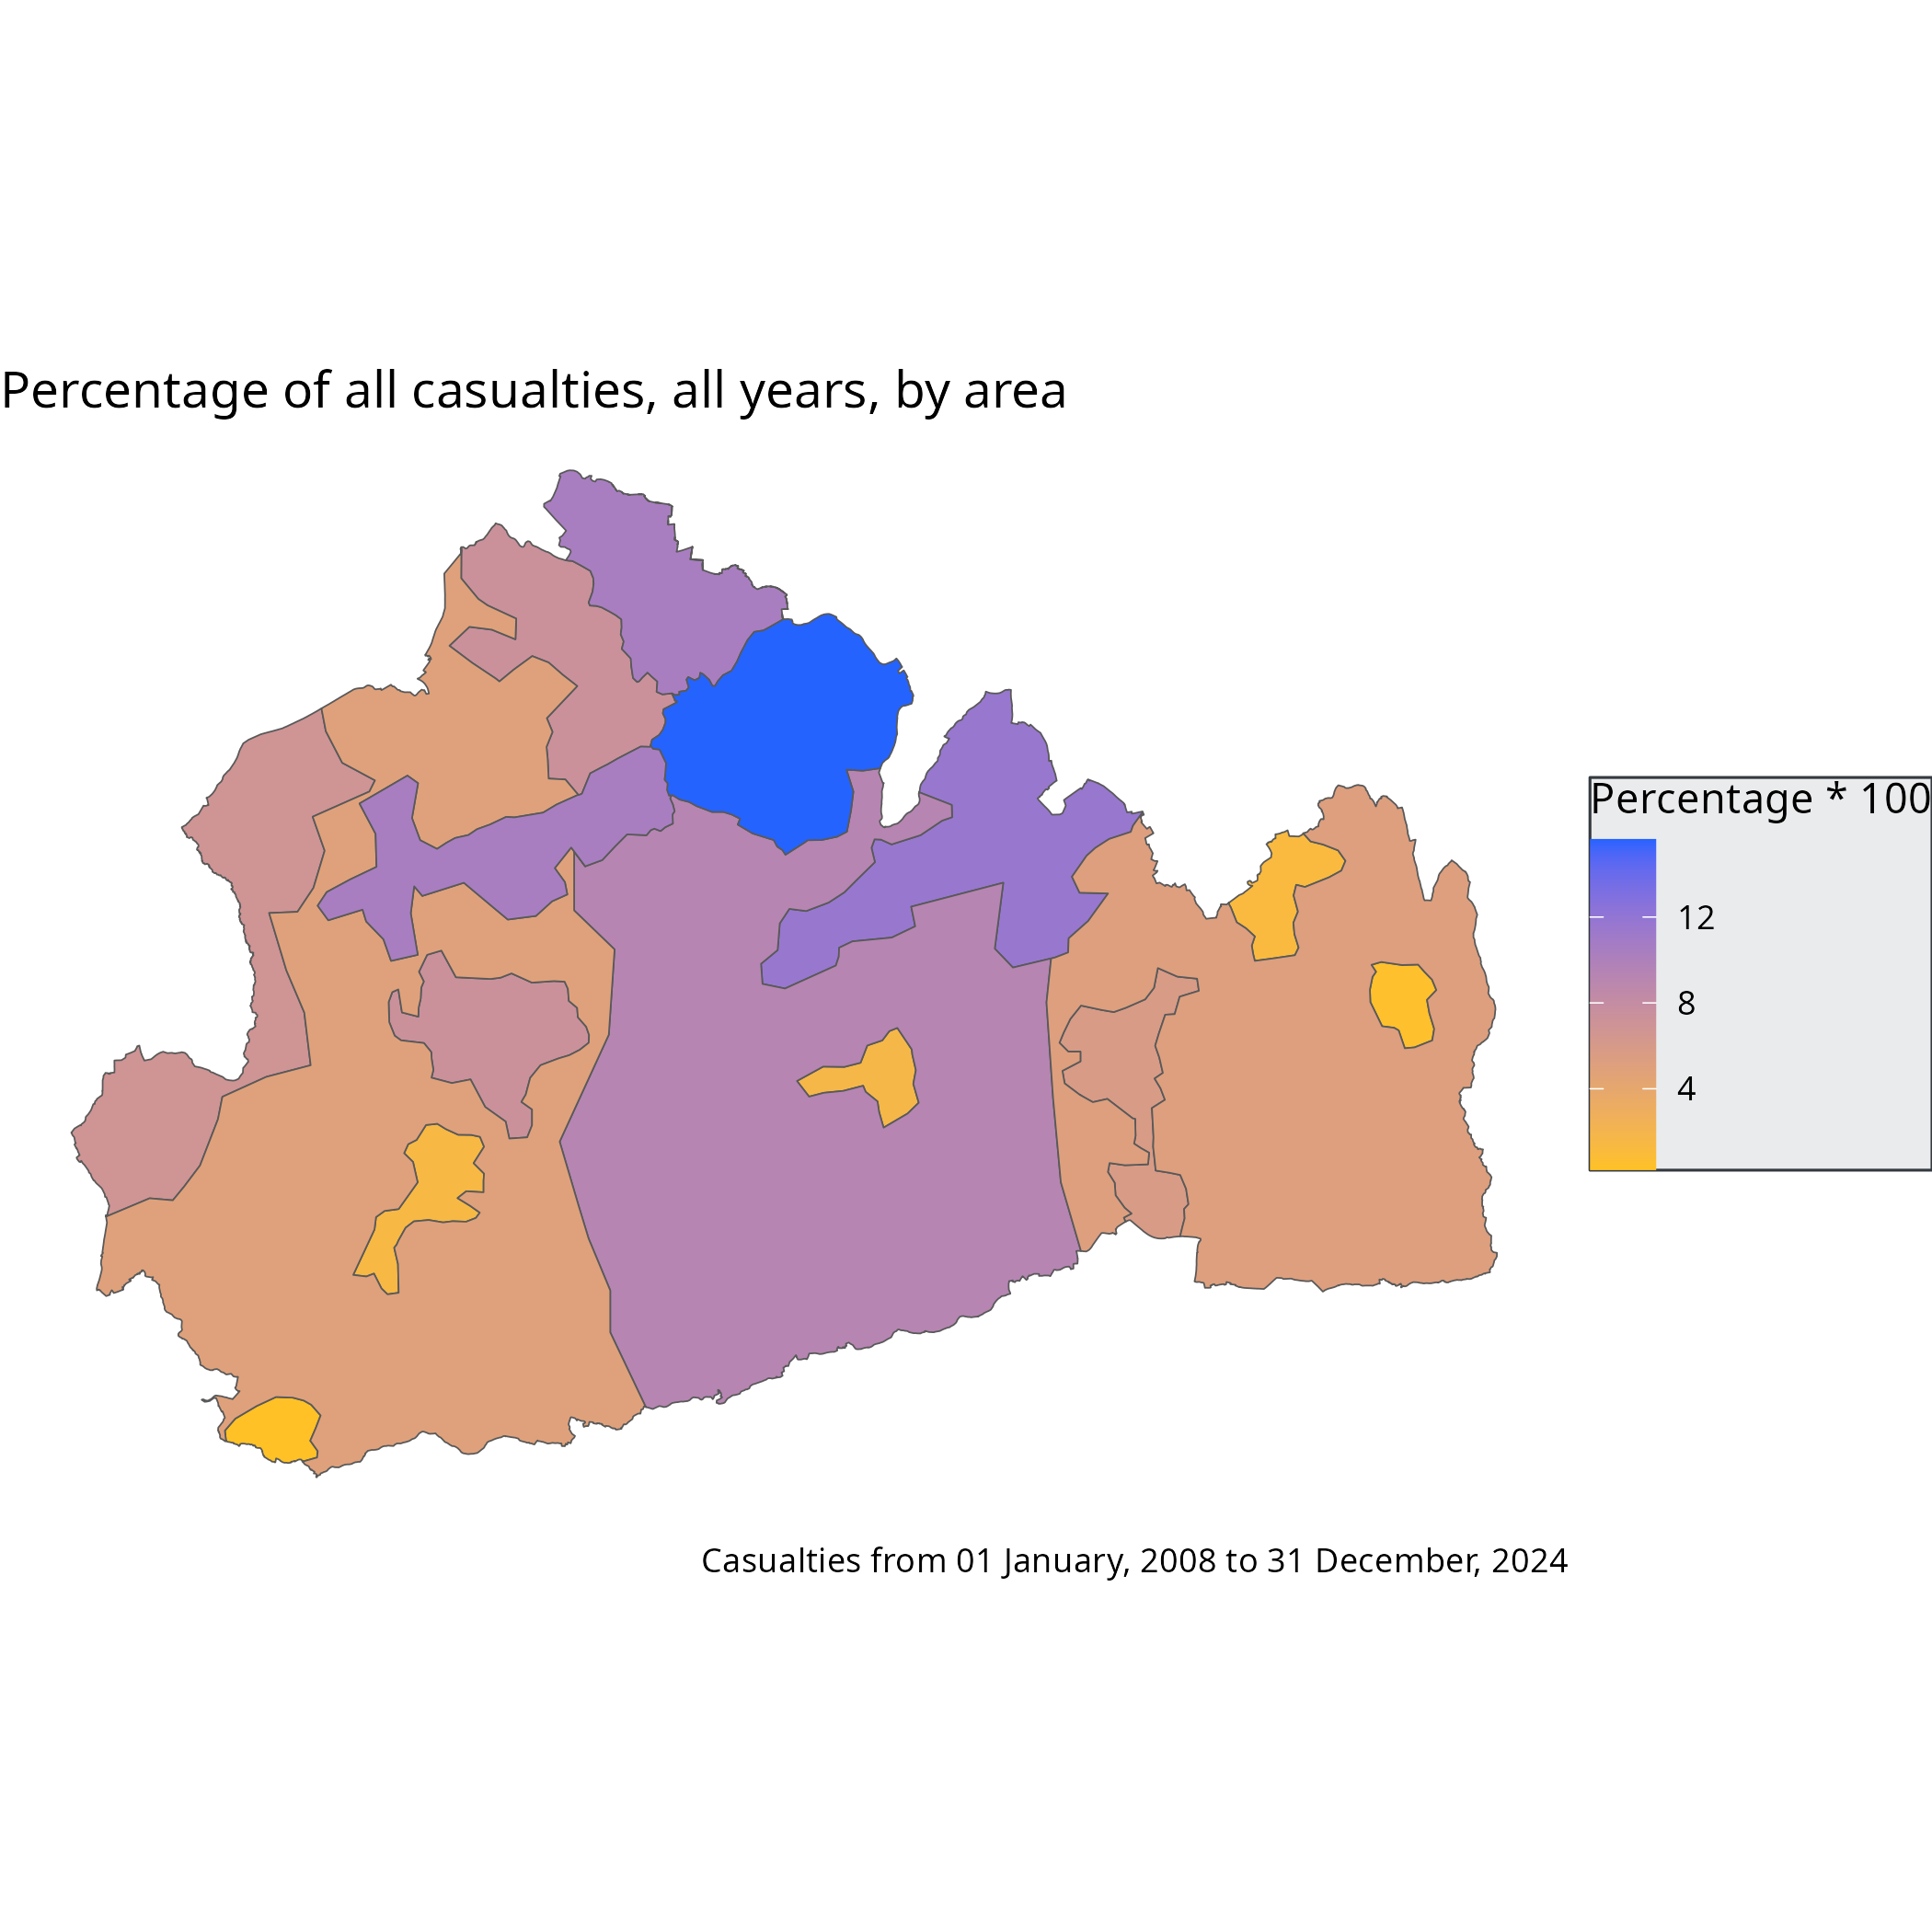
Casualties by area - north Surrey has a larger proportion of casualties
Surrey has been divided into sixteen discrete areas, comprising thirteen town areas and another three designated as ‘villages and countryside’:
| id | name |
|---|---|
| 1 | Addlestone, Chertsey, Egham, Virginia Water, Ottershaw |
| 2 | Blackwater Valley |
| 3 | Caterham, Warlingham |
| 4 | Dorking, Westcott |
| 5 | Epsom, Ewell, Banstead, Leatherhead, Fetcham, Bookham, Effingham |
| 6 | Farncombe, Godalming, Milford |
| 7 | Guildford, Worplesdon, Shalford |
| 8 | Haslemere, Shottermill |
| 9 | Oxted, Hurst Green |
| 10 | Reigate, Redhill, Merstham, Earlswood, Salfords, Horley |
| 11 | Staines, Ashford, Sunbury, Shepperton |
| 12 | Villages and countryside central |
| 13 | Villages and countryside east |
| 14 | Villages and countryside west |
| 15 | Weybridge, Walton, Molesey, Esher, Cobham |
| 16 | Woking, Byfleet, Knaphill, West End, Brookwood, Pirbright |
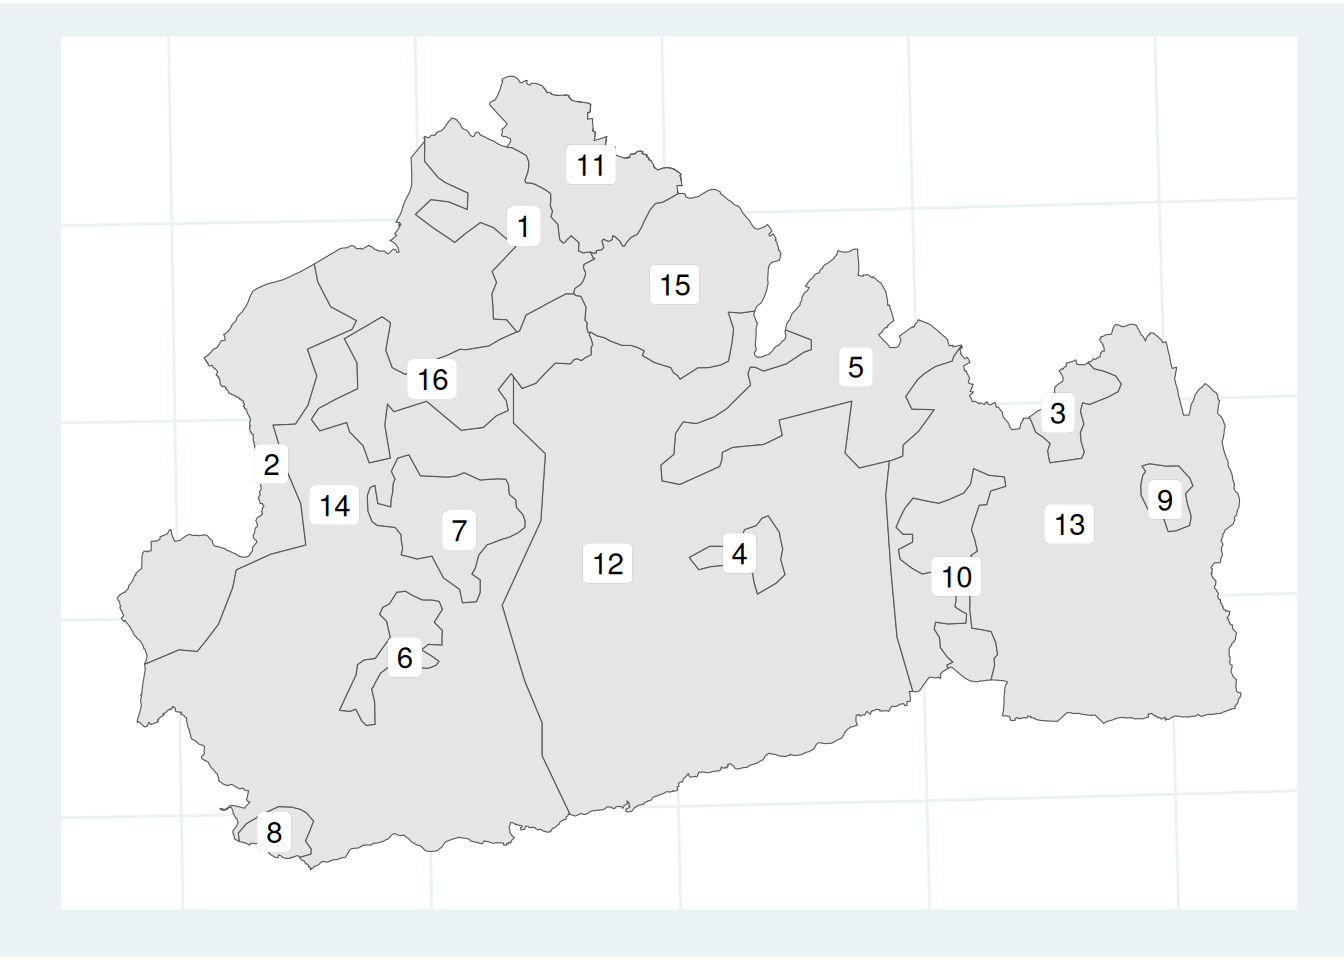
** Zoomable and pannable version of map here. On a separate page as it takes a while to load. **
The map below shows that the area “Weybridge, Walton, Molesey, Esher, Cobham”, has the largest proportion of cyclist casualties. It does not represent an extreme concentration of casualties though: the area has 16% of all cyclist casualties.
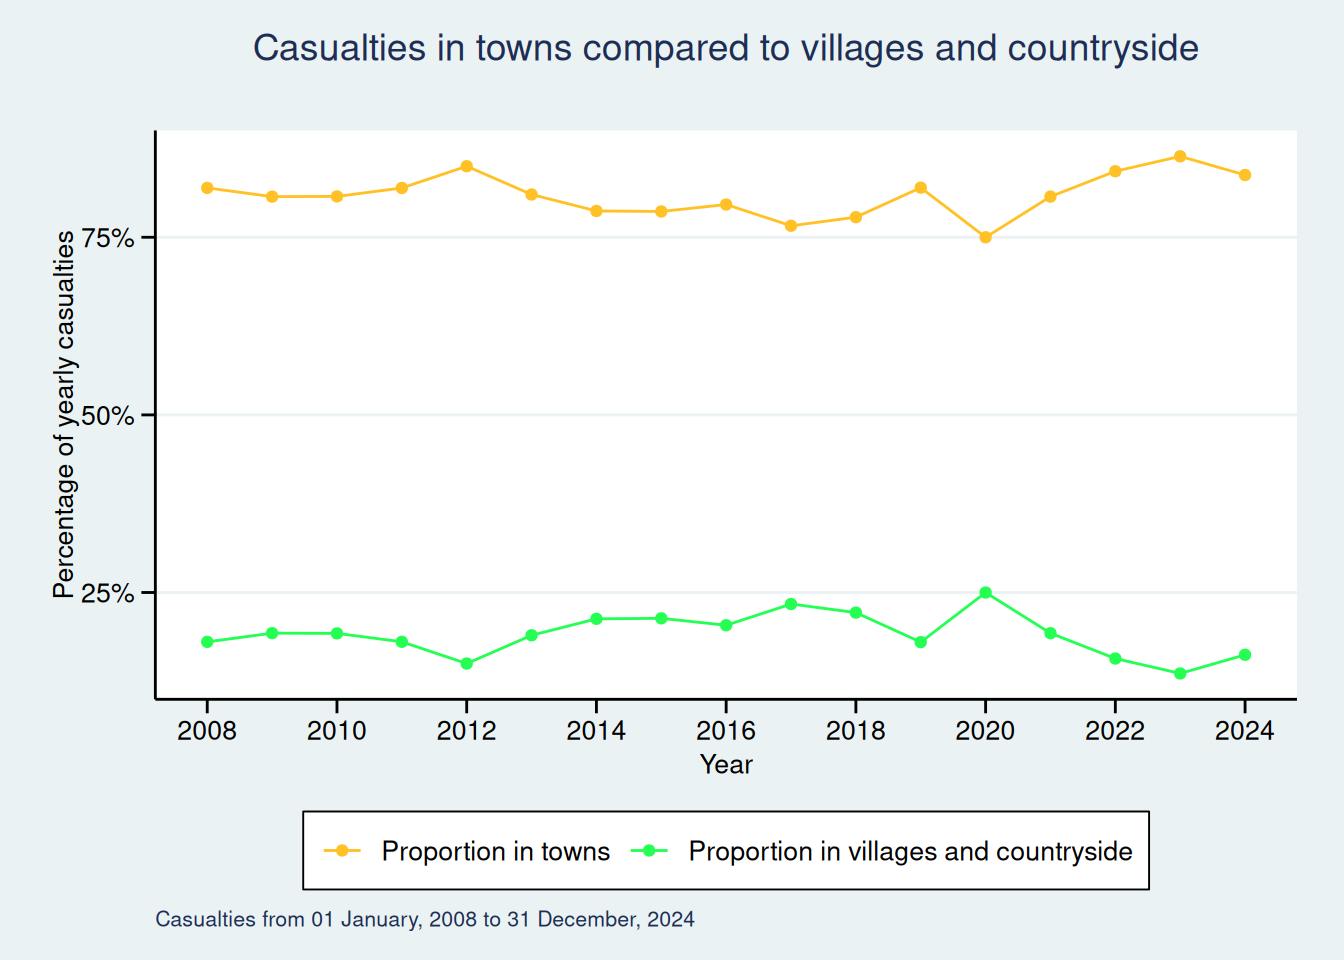
Casualties in towns and villages/countryside over time
Combining the totals from the three “villages and countryside” areas, then combining the other areas that are towns, shows that the proportion of casualties in built-up areas compared to rural areas has slightly increased in recent years:
The distribution of cyclist casualties differs to those of pedestrians and car occupants
The following plot shows the location of each individual cyclist casualty rather than grouping them into areas. This is intended to show clusters and also concentrations along road corridors. Each dot on the map below represents one casualty and each is shown at one-tenth of the colour’s full opacity. This gives an indication of density, as casualties at the same location result in a more opaque colour where they overlay each other.
The map shows clusters of cyclist casualties in several town centres and also a number of linear distributions.
A comparison is provided with pedestrians and car occupants by toggling the layer visibility on the map. Pedestrian casualties have similar town centre clusters but are relatively infrequent away from built-up areas. Car occupant casualties (slight delay as it loads) are firstly, much more numerous and secondly, have dense linear distributions along major roads such as motorways.
You can also zoom in but, as the points are of a large radius to provide enough colour for the initial map view, they do not work so well at a larger scale. The map of casualties by severity and year is better for looking at large scale.
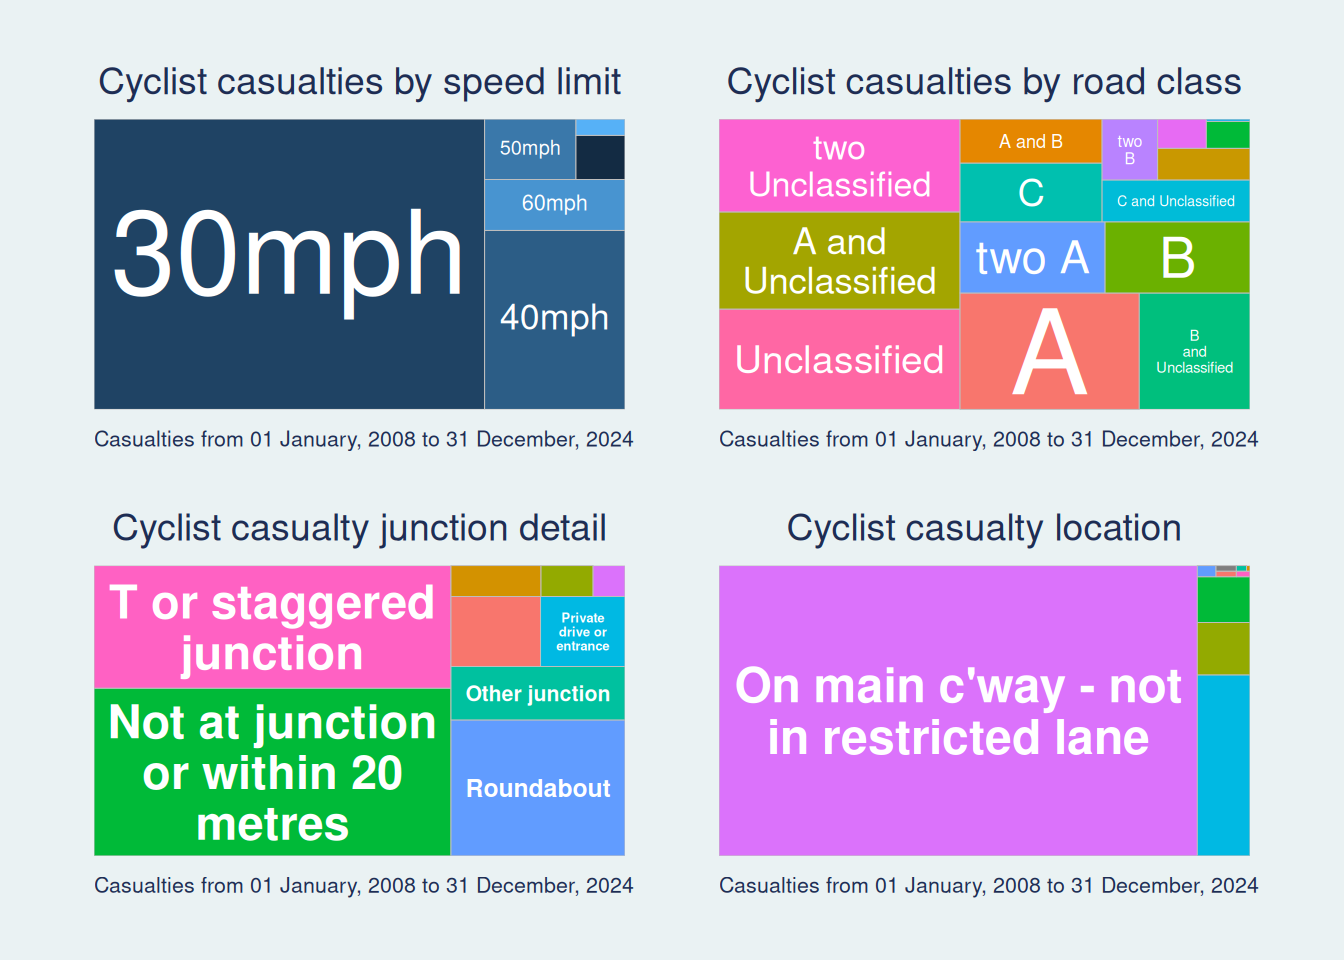
Road features - mostly 30mph limit, variety of road class and junction types
Stats19 records the speed limit entered at the collision location. The majority of cyclist casualties - 74% - are on roads with a 30mph speed limit.
The road class classifications in stats19 are Motorways. A(M), A, B, C and unclassified roads. Where the collision is at a junction, two road classes are shown in the chart below. The chart proportions the number of each category and no adjustment is made for road length or proportion of the different types of junction. No single category is very large, although 58% of casualties were either on or at a junction of an unclassified road.
‘At least 20 metres from a junction’ is the single biggest category, although collisions at all junctions combined comprise 57.2% of all cyclist casualties. Most casualties are in an ‘unrestricted lane’, meaning not a bus lane, cycle lane, hard shoulder, lay-by or on the pavement (footway).